Course Response Rate
| Raters | Students |
|---|---|
| Responded | 8 |
| Invited | 11 |
| Response Ratio | 73% |

Course General Questions
| Count | Excellent | Very Good | Good | Fair | Unsatisfactory | Course Mean | FAS Mean | |
|---|---|---|---|---|---|---|---|---|
| Evaluate the course overall. | 8 | 63% | 13% | 25% | 0% | 0% | 4.38 | 4.24 |
| Course materials (readings, audio-visual materials, textbooks, lab manuals, website, etc.) | 8 | 63% | 25% | 13% | 0% | 0% | 4.50 | 4.21 |
| Assignments (exams, essays, problem sets, language homework, etc.) | 8 | 63% | 13% | 13% | 13% | 0% | 4.25 | 4.10 |
| Feedback you received on work you produced in this course | 8 | 75% | 13% | 13% | 0% | 0% | 4.63 | 4.10 |
| Section component of the course | 1 | 100% | 0% | 0% | 0% | 0% | 5.00 | 4.26 |

General Instructor Questions
| Count | Excellent | Very Good | Good | Fair | Unsatisfactory | Instructor Mean | FAS Mean | |
|---|---|---|---|---|---|---|---|---|
| Evaluate your Instructor overall. | 8 | 63% | 38% | 0% | 0% | 0% | 4.63 | 4.50 |
| Gives effective lectures or presentations, if applicable | 8 | 63% | 25% | 13% | 0% | 0% | 4.50 | 4.41 |
| Is accessible outside of class (including after class, office hours, e-mail, etc.) | 8 | 63% | 38% | 0% | 0% | 0% | 4.63 | 4.45 |
| Generates enthusiasm for the subject matter | 8 | 63% | 38% | 0% | 0% | 0% | 4.63 | 4.57 |
| Facilitates discussion and encourages participation | 8 | 63% | 25% | 13% | 0% | 0% | 4.50 | 4.55 |
| Gives useful feedback on assignments | 8 | 63% | 38% | 0% | 0% | 0% | 4.63 | 4.49 |
| Returns assignments in a timely fashion | 8 | 50% | 38% | 13% | 0% | 0% | 4.38 | 4.46 |
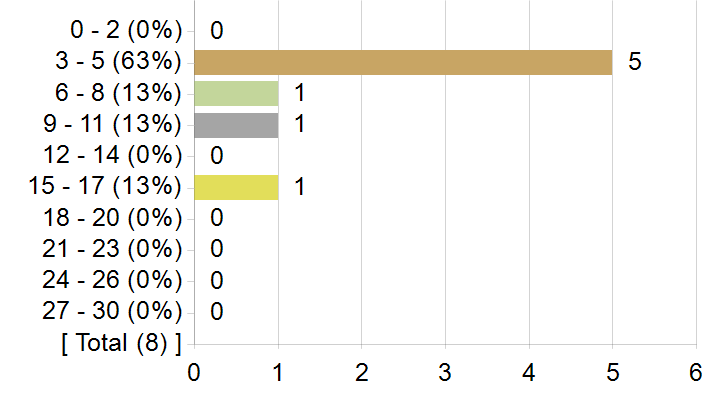
On average, how many hours per week did you spend on coursework outside of class? Enter a whole number between 0 and 168.
Frequency chart and mean excludes students who answered 31 or more hours.
On average, how many hours per week did you spend on coursework outside of class? Enter a whole number between 0 and 168.
| Statistics | Value |
|---|---|
| Response Count | 8 |
| Response Ratio | 73% |
| Mean | 6.00 |
| Median | 4.00 |
| Mode | 3 |
| Standard Deviation | 4.38 |
How strongly would you recommend this course to your peers?
How strongly would you recommend this course to your peers?

| Options | Score | Count | Percentage |
|---|---|---|---|
| Recommend with Enthusiasm | 5 | 5 | 63% |
| Likely to Recommend | 4 | 3 | 38% |
| Recommend with Reservations | 3 | 0 | 0% |
| Unlikely to Recommend | 2 | 0 | 0% |
| Definitely not Recommend | 1 | 0 | 0% |
| Statistics | Value |
|---|---|
| Response Ratio | 73% |
| Mean | 4.63 |
| Median | 5.00 |
| Standard Deviation | 0.52 |
What was/were your reason(s) for enrolling in this course? (Please check all that apply)
| Options | Count |
|---|---|
| Elective | 5 |
| Concentration or Department Requirement | 2 |
| Secondary Field or Language Citation Requirement | 1 |
| Undergraduate General Education Requirement | 0 |
| Expository Writing Requirement | 0 |
| Foreign Language Requirement | 0 |
| Pre-Med Requirement | 0 |
| Divisional Distribution Requirement | 1 |
| Quantitative Reasoning with Data Requirement | 0 |
In this course, most students listen attentively with an open mind and a willingness to change their point of view as they learn more about the topic.
In this course, most students listen attentively with an open mind and a willingness to change their point of view as they learn more about the topic.

| Options | Score | Count | Percentage |
|---|---|---|---|
| Strongly Agree | 5 | 5 | 63% |
| Agree | 4 | 1 | 13% |
| Neither Agree nor Disagree | 3 | 2 | 25% |
| Disagree | 2 | 0 | 0% |
| Strongly Disagree | 1 | 0 | 0% |
| Statistics | Value |
|---|---|
| Response Ratio | 73% |
| Mean | 4.38 |
| Median | 5.00 |
| Standard Deviation | 0.92 |
In this course (including sections), I feel comfortable expressing my views on controversial topics.
In this course (including sections), I feel comfortable expressing my views on controversial topics.

| Options | Score | Count | Percentage |
|---|---|---|---|
| Strongly Agree | 5 | 4 | 50% |
| Agree | 4 | 4 | 50% |
| Neither Agree nor Disagree | 3 | 0 | 0% |
| Disagree | 2 | 0 | 0% |
| Strongly Disagree | 1 | 0 | 0% |
| Statistics | Value |
|---|---|
| Response Ratio | 73% |
| Mean | 4.50 |
| Median | 4.50 |
| Standard Deviation | 0.53 |
Comments from students
What would you like to tell future students about this class? (Your response to this question may be published anonymously.)
| Comments |
|---|
| This is a fun class, and I believe that everyone should take it! But don't take the class if you are not willing to engage in potentially paradigm–shifting discussions. If you have prior pre–concieved notions regarding topics, that is fine, but if you aren't willing to at least adjust them, especially with sensitive topics as the ones discussed in class, you're literally wasting a course and preventing others from fulyl engaging in a conducive manner. Also do the readings! They are honestly not hard, and if you stay on top of them, you'll honestly be fine (but they are not also fully tested)! And be willing to participate! Even if you didn't do the readings, you still have the opportunity to engage in the discussion. There were a few times when people didn't want to participate which created a very awkward ambiance (especially towards the professor), so don't be one of those people. |
| If you are at all into dance music, or music in general, TAKE THIS COURSE. It will make you so much more knowledgeable about what you are actively listening to, and help you develop an appreciation for the music style's origins, not just the music itself. In a field where so much of the experience with dance music, whether in clubs, the Ballrooms, or venues, is about being in the present and in the moment, you as an examiner are doing IMPORTANT WORK. You are finding ways authentically excavate and resurface what could otherwise go unnoticed by most. |
| Really interesting class, not a gem though. If you are interested in EDM and especially the history behind it, I would recommend this class. Really interesting topics, readings, adn discussions. |
| This course was awesome. I added new music to my playlists every week. I had never really thought about EDM as a Black genre, but this class showed me otherwise. Whether it was a discussion about repetition and Blackness or an intellectual conversation about sipping lean, I was always excited for our time together. And the meditation at the beginning of class was always a treat! Professor Aumoithe is a wonderful and calming person and presence. He does an amazing job facilitating discussion and asks questions that really make you think. His feedback is also easy to understand and incorporate. Workload–wise, the class is less demanding than it previously was. However, it is not necessarily an easy class. You definitely need to stay on top of the weekly discussion posts and other assignments because they will creep up on you. Formatting assignments is a bit tedious, but you should get the hang of it after the first couple times. Overall, loved the course! Would take it again if I could. |
| Take this course if you have the opportunity. Listening sessions, guided meditations, and great seminar discussions |