Course Response Rate
| Raters | Students |
|---|---|
| Responded | 12 |
| Invited | 17 |
| Response Ratio | 71% |

Course General Questions
| Count | Excellent | Very Good | Good | Fair | Unsatisfactory | Course Mean | FAS Mean | |
|---|---|---|---|---|---|---|---|---|
| Evaluate the course overall. | 11 | 100% | 0% | 0% | 0% | 0% | 5.00 | 4.26 |
| Course materials (readings, audio-visual materials, textbooks, lab manuals, website, etc.) | 11 | 100% | 0% | 0% | 0% | 0% | 5.00 | 4.24 |
| Assignments (exams, essays, problem sets, language homework, etc.) | 10 | 100% | 0% | 0% | 0% | 0% | 5.00 | 4.14 |
| Feedback you received on work you produced in this course | 11 | 100% | 0% | 0% | 0% | 0% | 5.00 | 4.14 |
| Section component of the course | 3 | 100% | 0% | 0% | 0% | 0% | 5.00 | 4.29 |

General Instructor Questions
| Count | Excellent | Very Good | Good | Fair | Unsatisfactory | Instructor Mean | FAS Mean | |
|---|---|---|---|---|---|---|---|---|
| Evaluate your Instructor overall. | 11 | 100% | 0% | 0% | 0% | 0% | 5.00 | 4.54 |
| Gives effective lectures or presentations, if applicable | 11 | 100% | 0% | 0% | 0% | 0% | 5.00 | 4.46 |
| Is accessible outside of class (including after class, office hours, e-mail, etc.) | 11 | 91% | 9% | 0% | 0% | 0% | 4.91 | 4.52 |
| Generates enthusiasm for the subject matter | 11 | 100% | 0% | 0% | 0% | 0% | 5.00 | 4.61 |
| Facilitates discussion and encourages participation | 11 | 100% | 0% | 0% | 0% | 0% | 5.00 | 4.59 |
| Gives useful feedback on assignments | 10 | 100% | 0% | 0% | 0% | 0% | 5.00 | 4.52 |
| Returns assignments in a timely fashion | 11 | 100% | 0% | 0% | 0% | 0% | 5.00 | 4.49 |
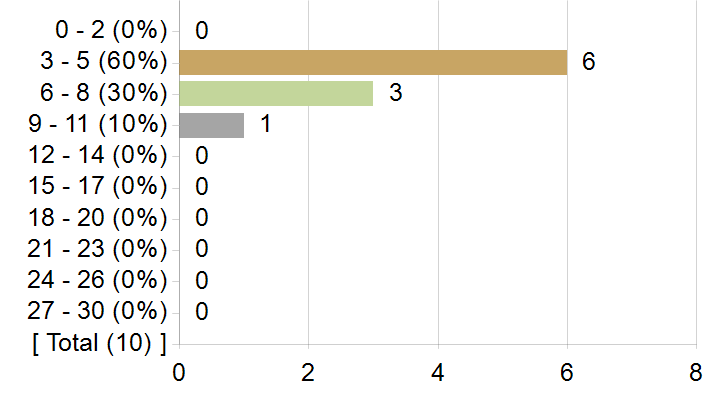
On average, how many hours per week did you spend on coursework outside of class? Enter a whole number between 0 and 168.
Frequency chart and mean excludes students who answered 31 or more hours.
On average, how many hours per week did you spend on coursework outside of class? Enter a whole number between 0 and 168.
| Statistics | Value |
|---|---|
| Response Count | 10 |
| Response Ratio | 59% |
| Mean | 5.80 |
| Median | 5.00 |
| Mode | 4 |
| Standard Deviation | 2.10 |
How strongly would you recommend this course to your peers?
How strongly would you recommend this course to your peers?

| Options | Score | Count | Percentage |
|---|---|---|---|
| Recommend with Enthusiasm | 5 | 11 | 100% |
| Likely to Recommend | 4 | 0 | 0% |
| Recommend with Reservations | 3 | 0 | 0% |
| Unlikely to Recommend | 2 | 0 | 0% |
| Definitely not Recommend | 1 | 0 | 0% |
| Statistics | Value |
|---|---|
| Response Ratio | 65% |
| Mean | 5.00 |
| Median | 5.00 |
| Standard Deviation | 0.00 |
What was/were your reason(s) for enrolling in this course? (Please check all that apply)
| Options | Count |
|---|---|
| Elective | 10 |
| Concentration or Department Requirement | 2 |
| Secondary Field or Language Citation Requirement | 0 |
| Undergraduate General Education Requirement | 0 |
| Expository Writing Requirement | 0 |
| Foreign Language Requirement | 0 |
| Pre-Med Requirement | 0 |
| Divisional Distribution Requirement | 0 |
| Quantitative Reasoning with Data Requirement | 0 |
In this course, most students listen attentively with an open mind and a willingness to change their point of view as they learn more about the topic.
In this course, most students listen attentively with an open mind and a willingness to change their point of view as they learn more about the topic.

| Options | Score | Count | Percentage |
|---|---|---|---|
| Strongly Agree | 5 | 9 | 82% |
| Agree | 4 | 1 | 9% |
| Neither Agree nor Disagree | 3 | 1 | 9% |
| Disagree | 2 | 0 | 0% |
| Strongly Disagree | 1 | 0 | 0% |
| Statistics | Value |
|---|---|
| Response Ratio | 65% |
| Mean | 4.73 |
| Median | 5.00 |
| Standard Deviation | 0.65 |
In this course (including sections), I feel comfortable expressing my views on controversial topics.
In this course (including sections), I feel comfortable expressing my views on controversial topics.

| Options | Score | Count | Percentage |
|---|---|---|---|
| Strongly Agree | 5 | 8 | 73% |
| Agree | 4 | 2 | 18% |
| Neither Agree nor Disagree | 3 | 1 | 9% |
| Disagree | 2 | 0 | 0% |
| Strongly Disagree | 1 | 0 | 0% |
| Statistics | Value |
|---|---|
| Response Ratio | 65% |
| Mean | 4.64 |
| Median | 5.00 |
| Standard Deviation | 0.67 |
Comments from students
What would you like to tell future students about this class? (Your response to this question may be published anonymously.)
| Comments |
|---|
| TAKE THIS COURSE if you get the opportunity. Fantastic all around. Interacting with Professor Gates is a delight, and the guest critics are truly amazing. You will walk away with an intimate sense of Du Bois and his legacy. |
| Du Bois is a man whose ability to tell a story through his writing is profound. Take the time to learn your own knee jerk reactions to his thoughts and see if they change throughout the semester. |
| Please take this course – or any course by Professor Gates. You get to hear from one of the preeminent voices in modern Black history, and you also read some Du Bois while you do it. |
| Take this class if you want to be intellectually transformed and historically grounded. One of the most unforgettable parts of this experience was the opportunity to learn from, and be footnoted by, a contemporary treasure: Dr. Henry Louis Gates, Jr. His brilliance, generosity, and commitment to telling the full story of Black life in America created a learning environment that was both rigorous and deeply affirming. This class is not just about acquiring knowledge. It’s about being in conversation with history, legacy, and living scholarship. You will leave more informed, more curious, and more connected to the ongoing project of truth–telling and justice. |
| Professor Gates is an absolute legend, and I would highly suggest this course to anyone who wants to explore early 20th century Black thought!! Using Du Bois as a lens makes it so that the class can cover over 60 years of history and political philosophy without getting lost. I learned so much! |
| Come in eager to learn and what you put into it, you will get out of it tenfold! |
| One of my favorite classes in my Harvard experience!! |
| No one should graduate from Harvard without taking a class from Professor Gates. It doesn't matter what class he is teaching––on W.E.B. Du Bois, on African–American literature, on underwater basket weaving––take it! He changed my life for the better, and he will do the same for you. He is an exceptionally insightful and creative mind who will teach you to think deeply and critically. He has a gift for making everyone feel welcome, accepted, and free to speak their minds, even on uncomfortable topics such as racism. Most important, Professor Gates is a person of extraordinary kindness, compassion, and generosity. I have seen many examples of his showing such grace to his students and staff. In our divisive world today, we need more people like Professor Gates. Taking a class from him is the first step! |