Course Response Rate
| Raters | Students |
|---|---|
| Responded | 20 |
| Invited | 28 |
| Response Ratio | 71% |

Course General Questions
| Count | Excellent | Very Good | Good | Fair | Unsatisfactory | Course Mean | FAS Mean | |
|---|---|---|---|---|---|---|---|---|
| Evaluate the course overall. | 17 | 82% | 18% | 0% | 0% | 0% | 4.82 | 4.25 |
| Course materials (readings, audio-visual materials, textbooks, lab manuals, website, etc.) | 16 | 75% | 19% | 6% | 0% | 0% | 4.69 | 4.25 |
| Assignments (exams, essays, problem sets, language homework, etc.) | 16 | 69% | 19% | 13% | 0% | 0% | 4.56 | 4.12 |
| Feedback you received on work you produced in this course | 13 | 77% | 15% | 8% | 0% | 0% | 4.69 | 4.13 |
| Section component of the course | 8 | 100% | 0% | 0% | 0% | 0% | 5.00 | 4.27 |

General Instructor Questions
| Count | Excellent | Very Good | Good | Fair | Unsatisfactory | Instructor Mean | FAS Mean | |
|---|---|---|---|---|---|---|---|---|
| Evaluate your Instructor overall. | 17 | 88% | 12% | 0% | 0% | 0% | 4.88 | 4.55 |
| Gives effective lectures or presentations, if applicable | 13 | 92% | 8% | 0% | 0% | 0% | 4.92 | 4.46 |
| Is accessible outside of class (including after class, office hours, e-mail, etc.) | 17 | 88% | 6% | 6% | 0% | 0% | 4.82 | 4.51 |
| Generates enthusiasm for the subject matter | 17 | 94% | 6% | 0% | 0% | 0% | 4.94 | 4.62 |
| Facilitates discussion and encourages participation | 17 | 82% | 18% | 0% | 0% | 0% | 4.82 | 4.58 |
| Gives useful feedback on assignments | 15 | 80% | 13% | 0% | 7% | 0% | 4.67 | 4.52 |
| Returns assignments in a timely fashion | 13 | 92% | 0% | 0% | 8% | 0% | 4.77 | 4.48 |
On average, how many hours per week did you spend on coursework outside of class? Enter a whole number between 0 and 168.
Frequency chart and mean excludes students who answered 31 or more hours.
On average, how many hours per week did you spend on coursework outside of class? Enter a whole number between 0 and 168.
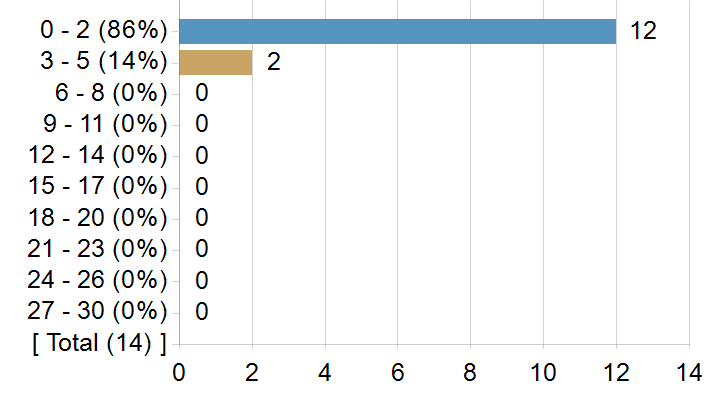
| Statistics | Value |
|---|---|
| Response Count | 14 |
| Response Ratio | 50% |
| Mean | 1.71 |
| Median | 1.00 |
| Mode | 1 |
| Standard Deviation | 1.33 |
How strongly would you recommend this course to your peers?
How strongly would you recommend this course to your peers?

| Options | Score | Count | Percentage |
|---|---|---|---|
| Recommend with Enthusiasm | 5 | 14 | 82% |
| Likely to Recommend | 4 | 3 | 18% |
| Recommend with Reservations | 3 | 0 | 0% |
| Unlikely to Recommend | 2 | 0 | 0% |
| Definitely not Recommend | 1 | 0 | 0% |
| Statistics | Value |
|---|---|
| Response Ratio | 61% |
| Mean | 4.82 |
| Median | 5.00 |
| Standard Deviation | 0.39 |
What was/were your reason(s) for enrolling in this course? (Please check all that apply)
| Options | Count |
|---|---|
| Elective | 12 |
| Concentration or Department Requirement | 0 |
| Secondary Field or Language Citation Requirement | 3 |
| Undergraduate General Education Requirement | 0 |
| Expository Writing Requirement | 0 |
| Foreign Language Requirement | 0 |
| Pre-Med Requirement | 0 |
| Divisional Distribution Requirement | 5 |
| Quantitative Reasoning with Data Requirement | 0 |
In this course, most students listen attentively with an open mind and a willingness to change their point of view as they learn more about the topic.
In this course, most students listen attentively with an open mind and a willingness to change their point of view as they learn more about the topic.

| Options | Score | Count | Percentage |
|---|---|---|---|
| Strongly Agree | 5 | 12 | 80% |
| Agree | 4 | 2 | 13% |
| Neither Agree nor Disagree | 3 | 1 | 7% |
| Disagree | 2 | 0 | 0% |
| Strongly Disagree | 1 | 0 | 0% |
| Statistics | Value |
|---|---|
| Response Ratio | 54% |
| Mean | 4.73 |
| Median | 5.00 |
| Standard Deviation | 0.59 |
In this course (including sections), I feel comfortable expressing my views on controversial topics.
In this course (including sections), I feel comfortable expressing my views on controversial topics.

| Options | Score | Count | Percentage |
|---|---|---|---|
| Strongly Agree | 5 | 9 | 60% |
| Agree | 4 | 3 | 20% |
| Neither Agree nor Disagree | 3 | 3 | 20% |
| Disagree | 2 | 0 | 0% |
| Strongly Disagree | 1 | 0 | 0% |
| Statistics | Value |
|---|---|
| Response Ratio | 54% |
| Mean | 4.40 |
| Median | 5.00 |
| Standard Deviation | 0.83 |
Comments from students
What would you like to tell future students about this class? (Your response to this question may be published anonymously.)
| Comments |
|---|
| This is a great course! I highly recommend this to any student that is even slightly curious about the African continent. You get to learn from a lot of different perspectives and the professor is great to talk to! The coursework is also very manageable since it's just one final essay and presentation + attendance. |
| Professor Ogene is one of the kindest professors I know. Definitely take his classes. You learn a lot about Africa in an extremely low–stress environment/workload :) |
| Don't just sit through class because it's easy; if you truly pay attention to the conversations had with the guest speakers you'll meet and even research the guest speakers in advance there is so much knowledge and experience you can gain insight into from engaging with them. |
| Definitely recommend this class especially if you are interested in African culture and you are looking for an easy going and interesting class. The only con is that the class is really long so sometimes it can get a bit boring but still heavily recommend the class. |
| This class is a chill class with a diverse exposure of topics. |
| Very interesting, positive academic experience. Relatively low workload, but you learn a great deal. The only thing is to meet with the professor because you won't receive feedback on anything throughout the semester– highly recommend! |
| Please please please take this course, it's actually a gem! Come into the class with an open–minded and willingness to learn about African culture and you will learn so much from the conversations with the guests. Also, Prof. Ogene is one of the kindest professors at this school, if not the kindest! |
| Prof Ogene is so kind, and this class is one of a kind. I really loved listening to incredible African artists speak about their life work. Absolutely amazing class |
| The class gives you a unique window into cultural production on the African continent. The class is very relaxed, and since your work outside of class is entirely focused on an independent research project, you get out what you put in. |