Course Response Rate
| Raters | Students |
|---|---|
| Responded | 21 |
| Invited | 24 |
| Response Ratio | 88% |

Course General Questions
| Count | Excellent | Very Good | Good | Fair | Unsatisfactory | Course Mean | FAS Mean | |
|---|---|---|---|---|---|---|---|---|
| Evaluate the course overall. | 19 | 37% | 42% | 16% | 5% | 0% | 4.11 | 4.24 |
| Course materials (readings, audio-visual materials, textbooks, lab manuals, website, etc.) | 19 | 58% | 16% | 26% | 0% | 0% | 4.32 | 4.21 |
| Assignments (exams, essays, problem sets, language homework, etc.) | 19 | 47% | 37% | 16% | 0% | 0% | 4.32 | 4.10 |
| Feedback you received on work you produced in this course | 19 | 47% | 32% | 11% | 11% | 0% | 4.16 | 4.10 |
| Section component of the course | 19 | 58% | 16% | 21% | 5% | 0% | 4.26 | 4.26 |

General Instructor Questions
| Count | Excellent | Very Good | Good | Fair | Unsatisfactory | Instructor Mean | FAS Mean | |
|---|---|---|---|---|---|---|---|---|
| Evaluate your Instructor overall. | 18 | 67% | 17% | 11% | 6% | 0% | 4.44 | 4.50 |
| Gives effective lectures or presentations, if applicable | 18 | 44% | 17% | 17% | 17% | 6% | 3.78 | 4.41 |
| Is accessible outside of class (including after class, office hours, e-mail, etc.) | 15 | 67% | 7% | 27% | 0% | 0% | 4.40 | 4.45 |
| Generates enthusiasm for the subject matter | 18 | 72% | 17% | 6% | 6% | 0% | 4.56 | 4.57 |
| Facilitates discussion and encourages participation | 16 | 63% | 6% | 25% | 6% | 0% | 4.25 | 4.55 |
| Gives useful feedback on assignments | 4 | 100% | 0% | 0% | 0% | 0% | 5.00 | 4.49 |
| Returns assignments in a timely fashion | 4 | 100% | 0% | 0% | 0% | 0% | 5.00 | 4.46 |
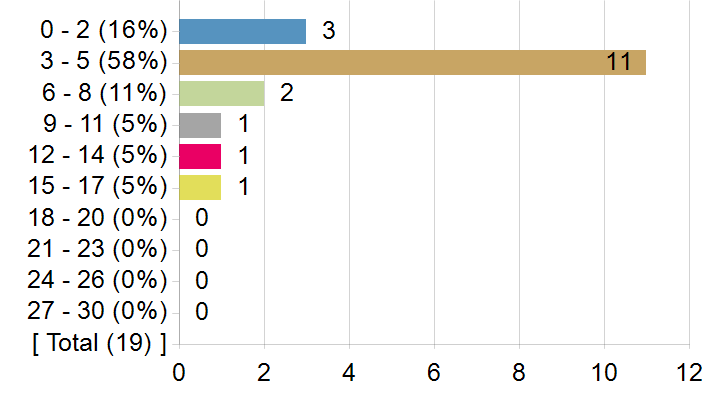
On average, how many hours per week did you spend on coursework outside of class? Enter a whole number between 0 and 168.
Frequency chart and mean excludes students who answered 31 or more hours.
On average, how many hours per week did you spend on coursework outside of class? Enter a whole number between 0 and 168.
| Statistics | Value |
|---|---|
| Response Count | 19 |
| Response Ratio | 79% |
| Mean | 5.47 |
| Median | 4.00 |
| Mode | 4, 5 |
| Standard Deviation | 3.76 |
How strongly would you recommend this course to your peers?
How strongly would you recommend this course to your peers?

| Options | Score | Count | Percentage |
|---|---|---|---|
| Recommend with Enthusiasm | 5 | 7 | 37% |
| Likely to Recommend | 4 | 10 | 53% |
| Recommend with Reservations | 3 | 2 | 11% |
| Unlikely to Recommend | 2 | 0 | 0% |
| Definitely not Recommend | 1 | 0 | 0% |
| Statistics | Value |
|---|---|
| Response Ratio | 79% |
| Mean | 4.26 |
| Median | 4.00 |
| Standard Deviation | 0.65 |
What was/were your reason(s) for enrolling in this course? (Please check all that apply)
| Options | Count |
|---|---|
| Elective | 8 |
| Concentration or Department Requirement | 9 |
| Secondary Field or Language Citation Requirement | 7 |
| Undergraduate General Education Requirement | 0 |
| Expository Writing Requirement | 0 |
| Foreign Language Requirement | 0 |
| Pre-Med Requirement | 0 |
| Divisional Distribution Requirement | 0 |
| Quantitative Reasoning with Data Requirement | 0 |
In this course, most students listen attentively with an open mind and a willingness to change their point of view as they learn more about the topic.
In this course, most students listen attentively with an open mind and a willingness to change their point of view as they learn more about the topic.

| Options | Score | Count | Percentage |
|---|---|---|---|
| Strongly Agree | 5 | 12 | 63% |
| Agree | 4 | 6 | 32% |
| Neither Agree nor Disagree | 3 | 1 | 5% |
| Disagree | 2 | 0 | 0% |
| Strongly Disagree | 1 | 0 | 0% |
| Statistics | Value |
|---|---|
| Response Ratio | 79% |
| Mean | 4.58 |
| Median | 5.00 |
| Standard Deviation | 0.61 |
In this course (including sections), I feel comfortable expressing my views on controversial topics.
In this course (including sections), I feel comfortable expressing my views on controversial topics.

| Options | Score | Count | Percentage |
|---|---|---|---|
| Strongly Agree | 5 | 9 | 50% |
| Agree | 4 | 8 | 44% |
| Neither Agree nor Disagree | 3 | 1 | 6% |
| Disagree | 2 | 0 | 0% |
| Strongly Disagree | 1 | 0 | 0% |
| Statistics | Value |
|---|---|
| Response Ratio | 75% |
| Mean | 4.44 |
| Median | 4.50 |
| Standard Deviation | 0.62 |
Comments from students
What would you like to tell future students about this class? (Your response to this question may be published anonymously.)
| Comments |
|---|
| I really enjoyed this class. Professor Perry is super knowledgeable and passionate and the readings and course syllabus flow really nicely together. This class was smaller than I expected and so lecture oftentimes involved a rich and open class discussion. The workload is super manageable and the readings are wonderful. |
| Great course! Highly recommend :) |
| This is a very good class |
| The workload is very manageable and the course material is interesting, yet easy to get through. |
| This is a great class for every Harvard student, regardless of their concentration! The style and syllabus depends on the professor teaching, but I really enjoyed Prof. Perry’s iteration of the course. Lecture is really interesting and is the main draw for a class like this. Beyond that, assignments are very few, open–ended, and easy, so very enjoyable, highly recommend! |
| I would take other AAAS classes before this, but it's super chill and reading not strict but also makes the course much more enjoyable. Professor Perry lectures and gets lost sometimes, but the course is very well intentioned |
| Taking this class is a worthwhile experience. The readings are short and relevant. The lecture contextualizes the readings. The discussions allow for you to make novel investigations into the course themes while pushing you to critically analyze and extrapolate from your lived experiences, the readings, and your peer's ideas. I would 100% recommend this course if you are interested in learning history while learning about yourself. |