Course Response Rate
| Raters | Students |
|---|---|
| Responded | 32 |
| Invited | 38 |
| Response Ratio | 84% |

Course General Questions
| Count | Excellent | Very Good | Good | Fair | Unsatisfactory | Course Mean | FAS Mean | |
|---|---|---|---|---|---|---|---|---|
| Evaluate the course overall. | 29 | 76% | 21% | 3% | 0% | 0% | 4.72 | 4.24 |
| Course materials (readings, audio-visual materials, textbooks, lab manuals, website, etc.) | 29 | 72% | 24% | 3% | 0% | 0% | 4.69 | 4.21 |
| Assignments (exams, essays, problem sets, language homework, etc.) | 28 | 79% | 11% | 11% | 0% | 0% | 4.68 | 4.10 |
| Feedback you received on work you produced in this course | 28 | 75% | 11% | 11% | 4% | 0% | 4.57 | 4.10 |
| Section component of the course | 27 | 78% | 15% | 7% | 0% | 0% | 4.70 | 4.26 |

General Instructor Questions
| Count | Excellent | Very Good | Good | Fair | Unsatisfactory | Instructor Mean | FAS Mean | |
|---|---|---|---|---|---|---|---|---|
| Evaluate your Instructor overall. | 27 | 89% | 11% | 0% | 0% | 0% | 4.89 | 4.50 |
| Gives effective lectures or presentations, if applicable | 27 | 74% | 26% | 0% | 0% | 0% | 4.74 | 4.41 |
| Is accessible outside of class (including after class, office hours, e-mail, etc.) | 25 | 60% | 24% | 8% | 8% | 0% | 4.36 | 4.45 |
| Generates enthusiasm for the subject matter | 27 | 89% | 11% | 0% | 0% | 0% | 4.89 | 4.57 |
| Facilitates discussion and encourages participation | 23 | 70% | 22% | 9% | 0% | 0% | 4.61 | 4.55 |
| Gives useful feedback on assignments | 12 | 92% | 0% | 8% | 0% | 0% | 4.83 | 4.49 |
| Returns assignments in a timely fashion | 11 | 100% | 0% | 0% | 0% | 0% | 5.00 | 4.46 |
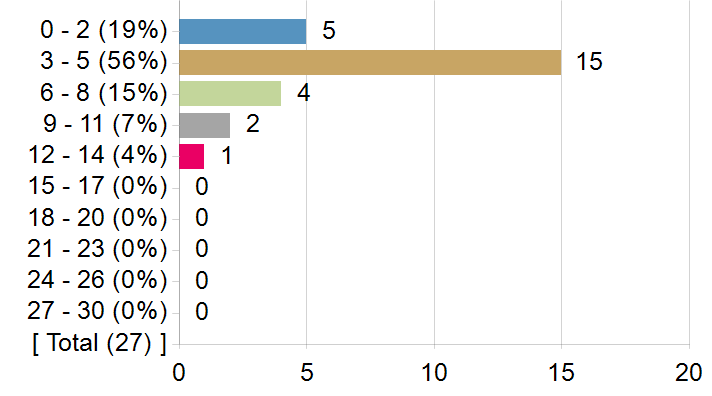
On average, how many hours per week did you spend on coursework outside of class? Enter a whole number between 0 and 168.
Frequency chart and mean excludes students who answered 31 or more hours.
On average, how many hours per week did you spend on coursework outside of class? Enter a whole number between 0 and 168.
| Statistics | Value |
|---|---|
| Response Count | 27 |
| Response Ratio | 71% |
| Mean | 4.67 |
| Median | 4.00 |
| Mode | 3 |
| Standard Deviation | 2.62 |
How strongly would you recommend this course to your peers?
How strongly would you recommend this course to your peers?

| Options | Score | Count | Percentage |
|---|---|---|---|
| Recommend with Enthusiasm | 5 | 24 | 83% |
| Likely to Recommend | 4 | 5 | 17% |
| Recommend with Reservations | 3 | 0 | 0% |
| Unlikely to Recommend | 2 | 0 | 0% |
| Definitely not Recommend | 1 | 0 | 0% |
| Statistics | Value |
|---|---|
| Response Ratio | 76% |
| Mean | 4.83 |
| Median | 5.00 |
| Standard Deviation | 0.38 |
What was/were your reason(s) for enrolling in this course? (Please check all that apply)
| Options | Count |
|---|---|
| Elective | 12 |
| Concentration or Department Requirement | 4 |
| Secondary Field or Language Citation Requirement | 10 |
| Undergraduate General Education Requirement | 1 |
| Expository Writing Requirement | 0 |
| Foreign Language Requirement | 0 |
| Pre-Med Requirement | 0 |
| Divisional Distribution Requirement | 4 |
| Quantitative Reasoning with Data Requirement | 0 |
In this course, most students listen attentively with an open mind and a willingness to change their point of view as they learn more about the topic.
In this course, most students listen attentively with an open mind and a willingness to change their point of view as they learn more about the topic.

| Options | Score | Count | Percentage |
|---|---|---|---|
| Strongly Agree | 5 | 21 | 75% |
| Agree | 4 | 6 | 21% |
| Neither Agree nor Disagree | 3 | 1 | 4% |
| Disagree | 2 | 0 | 0% |
| Strongly Disagree | 1 | 0 | 0% |
| Statistics | Value |
|---|---|
| Response Ratio | 74% |
| Mean | 4.71 |
| Median | 5.00 |
| Standard Deviation | 0.53 |
In this course (including sections), I feel comfortable expressing my views on controversial topics.
In this course (including sections), I feel comfortable expressing my views on controversial topics.

| Options | Score | Count | Percentage |
|---|---|---|---|
| Strongly Agree | 5 | 21 | 75% |
| Agree | 4 | 4 | 14% |
| Neither Agree nor Disagree | 3 | 3 | 11% |
| Disagree | 2 | 0 | 0% |
| Strongly Disagree | 1 | 0 | 0% |
| Statistics | Value |
|---|---|
| Response Ratio | 74% |
| Mean | 4.64 |
| Median | 5.00 |
| Standard Deviation | 0.68 |
Comments from students
What would you like to tell future students about this class? (Your response to this question may be published anonymously.)
| Comments |
|---|
| It is a fairly easy class and as long as you do not procrastinate on the readings you will do fine! The lectures are interesting so be engaged! Sections are also pretty lax so do not stress about reviewing the notes you took for the readings prior. It tends to be a review on the topics covered during lecture with some references to the reading. |
| Awesome class. Lectures are long but interesting. Assignments are not hard but require time management as you need to read a book before writing a book review. Weekly quizzes are easy if you at least look at the readings. Section was by far my favorite part of the class and the topics were interesting to discuss with my peers! |
| Take this class!!! It is by far my favorite course here at Harvard and an excellent place to engage with statistical data on health disparities, but also real–life solutions in place to help. Very great for people interested in public health and/or medicine! Professor Williams is a great professor, and my TF (Gakii) was excellent as well. |
| RUN AND TAKE THIS CLASS! You will learn and engage with a globally acclaimed professor who is extremely informed about the subject. GO TO OFFICE HOURS and get to know Dr Williams, he is genuinely an interesting, kind, and accommodating professor, very approachable, and has an interesting background. Go to section! Gakii Masunga is genuinely a great educator and empathetic. GREAT CLASS! |
| TAKE THIS COURSE. If you are interested in public health and/or African–American health disparities, this class is perfect for you. Professor Williams is great and teaches the course effectively. Ensure you stay on top of the readings and participate in section. |
| There is not a lot of engagement in lectures, but you can get that with section |
| It was a privilege to take this class with Dr. Williams. He is a superb lecturer, funny, and so kind. I regret not going to his office hours more, and I would definitely encourage anyone taking this class to do so. He is a leading expert in the field of health and its social determinants. Please take this class if you're at all interested in the topic. My only qualms were that the lectures felt long, and you don't get to engage much with the professor or other students. * |
| I think you should definitely TAKE THIS CLASSS! Even if you're not interested in medicine or healthcare, you truly learn so much in this class, as our lessons are very much applicable to things going on today. I'd consider this course a gem, to be honest, but you also gain so much from it–– especially a new mindset and perspective on the role of race in our society and how it affects everything. I feel like this should be a mandatory course regardless of your concentration plans. So many people will never learn all that we learned in the course of the semester, and I feel as though they should. Professor Williams is an amazing lecturer and he's so engaging. He's also funny and extremely passionate about the work he does. I'm so glad I took this class. The workload was way more than manageable. Your only assignments are really the three book reports due throughout the course of the semester which are only four pages long and really chill. I'm extremely glad that I took this course freshman year. In classes like these, it is easy to feel hopeless and stuck as it seems like the heartbreaking issues we learn about can't simply be fixed by us. However, Professor Williams would usually end lectures with positive statements about what we CAN do and inspiring stories from successful reform initiatives. |
| This course was amazing. I transferred in a bit later into the semester and they were so accommodating and flexible with helping me catch up. I was not planning on pursuing anything in medical field prior to taking this class and now I am looking into health policy. There was a ton of readings and research papers that you need to read in order to understand the class, so I ended up getting Speechify. It honestly helped me out so much and made me feel like I understood the discussions. Loved it, please never end this class! |
| Take this class! As a pre–med student who will probably never have room in my schedule again to take an African American studies course, I am so happy that I was able to take this one. It was very interesting and the material was eye–opening. |
| Definitely take! At times it is a gem and at other times it is not (cram reading pretty decent–sized books and writing reports on them in 1 week), but overall the workload was not terrible. Something I wish I would have known going in is that there are weekly quizzes. Overall, super interesting course tho and lowkey a vibe. |
| TAKE THIS CLASS! TEACHING STAFF IS AWESOME! WILL LEARN A LOT IN LOW STRESS ENVIRONMENT! |