Course Response Rate
| Raters | Students |
|---|---|
| Responded | 14 |
| Invited | 20 |
| Response Ratio | 70% |

Course General Questions
| Count | Excellent | Very Good | Good | Fair | Unsatisfactory | Course Mean | FAS Mean | |
|---|---|---|---|---|---|---|---|---|
| Evaluate the course overall. | 11 | 27% | 55% | 9% | 9% | 0% | 4.00 | 4.21 |
| Course materials (readings, audio-visual materials, textbooks, lab manuals, website, etc.) | 11 | 36% | 36% | 27% | 0% | 0% | 4.09 | 4.20 |
| Assignments (exams, essays, problem sets, language homework, etc.) | 11 | 36% | 55% | 9% | 0% | 0% | 4.27 | 4.07 |
| Feedback you received on work you produced in this course | 11 | 45% | 45% | 9% | 0% | 0% | 4.36 | 4.08 |
| Section component of the course | 11 | 64% | 18% | 9% | 9% | 0% | 4.36 | 4.22 |

General Instructor Questions
| Count | Excellent | Very Good | Good | Fair | Unsatisfactory | Instructor Mean | FAS Mean | |
|---|---|---|---|---|---|---|---|---|
| Evaluate your Instructor overall. | 8 | 38% | 50% | 0% | 13% | 0% | 4.13 | 4.51 |
| Gives effective lectures or presentations, if applicable | 8 | 63% | 0% | 25% | 13% | 0% | 4.13 | 4.39 |
| Is accessible outside of class (including after class, office hours, e-mail, etc.) | 8 | 13% | 13% | 50% | 25% | 0% | 3.13 | 4.44 |
| Generates enthusiasm for the subject matter | 8 | 75% | 13% | 0% | 13% | 0% | 4.50 | 4.58 |
| Facilitates discussion and encourages participation | 8 | 38% | 13% | 25% | 13% | 13% | 3.50 | 4.52 |
| Gives useful feedback on assignments | 4 | 75% | 0% | 25% | 0% | 0% | 4.50 | 4.45 |
| Returns assignments in a timely fashion | 4 | 0% | 50% | 0% | 50% | 0% | 3.00 | 4.43 |
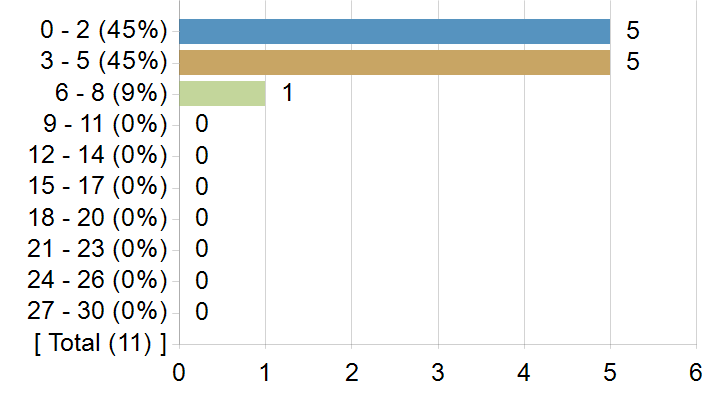
On average, how many hours per week did you spend on coursework outside of class? Enter a whole number between 0 and 168.
Frequency chart and mean excludes students who answered 31 or more hours.
On average, how many hours per week did you spend on coursework outside of class? Enter a whole number between 0 and 168.
| Statistics | Value |
|---|---|
| Response Count | 11 |
| Response Ratio | 55% |
| Mean | 3.00 |
| Median | 3.00 |
| Mode | 2, 3 |
| Standard Deviation | 1.67 |
How strongly would you recommend this course to your peers?
How strongly would you recommend this course to your peers?

| Options | Score | Count | Percentage |
|---|---|---|---|
| Recommend with Enthusiasm | 5 | 4 | 36% |
| Likely to Recommend | 4 | 6 | 55% |
| Recommend with Reservations | 3 | 0 | 0% |
| Unlikely to Recommend | 2 | 1 | 9% |
| Definitely not Recommend | 1 | 0 | 0% |
| Statistics | Value |
|---|---|
| Response Ratio | 55% |
| Mean | 4.18 |
| Median | 4.00 |
| Standard Deviation | 0.87 |
What was/were your reason(s) for enrolling in this course? (Please check all that apply)
| Options | Count |
|---|---|
| Elective | 4 |
| Concentration or Department Requirement | 1 |
| Secondary Field or Language Citation Requirement | 7 |
| Undergraduate General Education Requirement | 0 |
| Expository Writing Requirement | 0 |
| Foreign Language Requirement | 0 |
| Pre-Med Requirement | 0 |
| Divisional Distribution Requirement | 2 |
| Quantitative Reasoning with Data Requirement | 0 |
Comments from students
What would you like to tell future students about this class? (Your response to this question may be published anonymously.)
| Comments |
|---|
| Take this course! Super interesting and interdisciplinary. Dr. Williams is a legend in this field and a wealth of knowledge. Not very labor intensive assignment wise which is a huge bonus. |
| Lecture can be tedious but you will not regret showing up to class! It makes the writing prompts so much easier than trying to sift through hundreds of lecture slides when it comes time for essays. |
| Take it. Best class at Harvard. Will balance out a harder course load and be your most interesting class at the same time. Necessary for anyone interested in medicine in any way, and teaches about racism on a scale that extends far beyond the healthcare system. |
| The content, assignments, and readings are the best part of this course. Lectures and sections are the worst (lectures always go overtime and often the professor reads off the slides). I am unlikely to recommend it, but found the materials outside of class very interesting. |
| I feel like this is a very basic, introductory class to the social determinants of health. The professor spends the entire 2.5 hours lecturing, so if you want a class where you can be super involved, I do not recommend. Otherwise, the course material is interesting and the assignments are really easy, so if you want a GEM, I would recommend this for sure. |
| I would tell students to absolutely take this course! The workload is overbearing and the material is very interesting. However, understand that this class is a 2–hour lecture which isn't an ideal learning environment for everyone. |