Course Response Rate
| Raters | Students |
|---|---|
| Responded | 22 |
| Invited | 32 |
| Response Ratio | 69% |

Course General Questions
| Count | Excellent | Very Good | Good | Fair | Unsatisfactory | Course Mean | FAS Mean | |
|---|---|---|---|---|---|---|---|---|
| Evaluate the course overall. | 20 | 75% | 20% | 5% | 0% | 0% | 4.70 | 4.26 |
| Course materials (readings, audio-visual materials, textbooks, lab manuals, website, etc.) | 20 | 85% | 10% | 5% | 0% | 0% | 4.80 | 4.24 |
| Assignments (exams, essays, problem sets, language homework, etc.) | 19 | 74% | 5% | 21% | 0% | 0% | 4.53 | 4.14 |
| Feedback you received on work you produced in this course | 18 | 67% | 6% | 6% | 6% | 17% | 4.00 | 4.14 |
| Section component of the course | 11 | 73% | 9% | 9% | 9% | 0% | 4.45 | 4.29 |

General Instructor Questions
| Count | Excellent | Very Good | Good | Fair | Unsatisfactory | Instructor Mean | FAS Mean | |
|---|---|---|---|---|---|---|---|---|
| Evaluate your Instructor overall. | 20 | 85% | 15% | 0% | 0% | 0% | 4.85 | 4.54 |
| Gives effective lectures or presentations, if applicable | 20 | 85% | 10% | 5% | 0% | 0% | 4.80 | 4.46 |
| Is accessible outside of class (including after class, office hours, e-mail, etc.) | 19 | 74% | 16% | 5% | 5% | 0% | 4.58 | 4.52 |
| Generates enthusiasm for the subject matter | 20 | 95% | 5% | 0% | 0% | 0% | 4.95 | 4.61 |
| Facilitates discussion and encourages participation | 19 | 84% | 16% | 0% | 0% | 0% | 4.84 | 4.59 |
| Gives useful feedback on assignments | 14 | 86% | 7% | 7% | 0% | 0% | 4.79 | 4.52 |
| Returns assignments in a timely fashion | 13 | 85% | 8% | 8% | 0% | 0% | 4.77 | 4.49 |
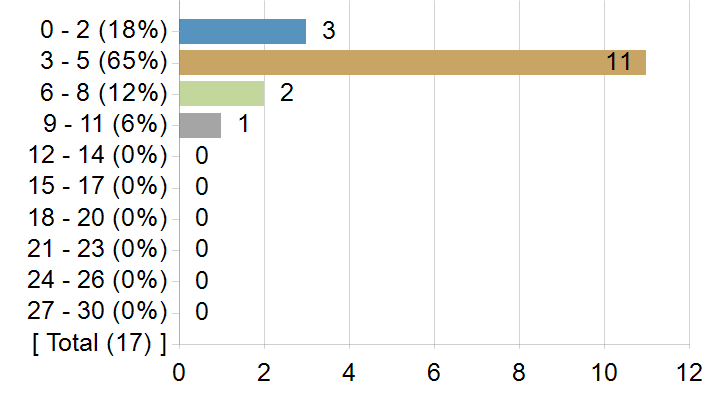
On average, how many hours per week did you spend on coursework outside of class? Enter a whole number between 0 and 168.
Frequency chart and mean excludes students who answered 31 or more hours.
On average, how many hours per week did you spend on coursework outside of class? Enter a whole number between 0 and 168.
| Statistics | Value |
|---|---|
| Response Count | 17 |
| Response Ratio | 53% |
| Mean | 4.53 |
| Median | 5.00 |
| Mode | 5 |
| Standard Deviation | 2.12 |
How strongly would you recommend this course to your peers?
How strongly would you recommend this course to your peers?

| Options | Score | Count | Percentage |
|---|---|---|---|
| Recommend with Enthusiasm | 5 | 16 | 80% |
| Likely to Recommend | 4 | 2 | 10% |
| Recommend with Reservations | 3 | 2 | 10% |
| Unlikely to Recommend | 2 | 0 | 0% |
| Definitely not Recommend | 1 | 0 | 0% |
| Statistics | Value |
|---|---|
| Response Ratio | 63% |
| Mean | 4.70 |
| Median | 5.00 |
| Standard Deviation | 0.66 |
What was/were your reason(s) for enrolling in this course? (Please check all that apply)
| Options | Count |
|---|---|
| Elective | 10 |
| Concentration or Department Requirement | 6 |
| Secondary Field or Language Citation Requirement | 4 |
| Undergraduate General Education Requirement | 0 |
| Expository Writing Requirement | 0 |
| Foreign Language Requirement | 0 |
| Pre-Med Requirement | 0 |
| Divisional Distribution Requirement | 1 |
| Quantitative Reasoning with Data Requirement | 0 |
In this course, most students listen attentively with an open mind and a willingness to change their point of view as they learn more about the topic.
In this course, most students listen attentively with an open mind and a willingness to change their point of view as they learn more about the topic.

| Options | Score | Count | Percentage |
|---|---|---|---|
| Strongly Agree | 5 | 16 | 80% |
| Agree | 4 | 4 | 20% |
| Neither Agree nor Disagree | 3 | 0 | 0% |
| Disagree | 2 | 0 | 0% |
| Strongly Disagree | 1 | 0 | 0% |
| Statistics | Value |
|---|---|
| Response Ratio | 63% |
| Mean | 4.80 |
| Median | 5.00 |
| Standard Deviation | 0.41 |
In this course (including sections), I feel comfortable expressing my views on controversial topics.
In this course (including sections), I feel comfortable expressing my views on controversial topics.

| Options | Score | Count | Percentage |
|---|---|---|---|
| Strongly Agree | 5 | 13 | 68% |
| Agree | 4 | 5 | 26% |
| Neither Agree nor Disagree | 3 | 1 | 5% |
| Disagree | 2 | 0 | 0% |
| Strongly Disagree | 1 | 0 | 0% |
| Statistics | Value |
|---|---|
| Response Ratio | 59% |
| Mean | 4.63 |
| Median | 5.00 |
| Standard Deviation | 0.60 |
Comments from students
What would you like to tell future students about this class? (Your response to this question may be published anonymously.)
| Comments |
|---|
| Dr. Perry's facilitation of class discussion is a dream |
| Take this class with caution...based on the experience of my friend who took the class a year before me, the graduate students and TF can make or break your experience as an undergrad. Great collection of texts and seminal readings in the Black Feminist Theory space. Horrible TF and many graduate students lacked the depth necessary to converse on these topics yet thought they were brilliant...and Professor Perry indulged them for reasons beyond me! We were supposed to have a final but the TF was so unorganized that the midterm wasn't returned until AFTER the last day of class so the final was cancelled which was good for us I guess. Technically, the midterm still hasn't been returned, but they keep promising it will be soon (although they've lied about this before so who knows). Some of the sources weren't accessible on Hollis as we were told they would be and the course staff was inaccessible when you emailed them about this. If you're willing to just learn this content on your own though and engage with the readings, you'll have a great time. Nevertheless, Professor Perry is knowledgeable. |
| Take this class. It has changed my life and ignited a fire in me. This is not just an academic experience. t’s a spiritual awakening, political education, and a personal reckoning all in one. You will leave with more than knowledge; you will leave transformed.Professor Imani Perry creates a space that honors your full humanity. Through deep engagement with Black feminist thought, oral histories, African traditions, law, spirituality, and literature. You’ll uncover truths that have been hidden or silenced. You’ll also uncover parts of yourself. This course will challenge you to think critically, feel deeply, and show up fully. Whether you’ve studied this history before or are coming in new. You will be given the tools to grow, to heal, and to lead. I carry this class with me every day. It reminded me of who I am and who I’m becoming. You won’t regret this class. If I could take it a thousand times I would. |
| This course is really interesting! The readings aren't overwhelming, but start them early so you're prepared for class. Also, consider buying the New Daughters of Africa book online, because some of those readings aren't available on Hollis/Canvas (at least at the time that I'm writing this). The communication in my year also wasn't great––I still haven't received any feedback on my midterm exam or contributions to the discussion boards, and our final take–home exam/essay got canceled seemingly because the prompt wasn't uploaded soon enough, so there are some administrative things that may be a little frustrating, but the in–class discussions are rich and interesting and very relevant/applicable. |
| Immerse yourself in the course and find how it empowers you to move with a sense of agency and belonging. |
| This is a wonderful class that anyone can and should take who wants to learn more about or engage more deeply with Black feminist theory. Professor Perry is lovely and so is Imani. The mix of undergraduates and graduate students expands class perspectives and has a unique way of enriching discussions. The assignments allow you to reflect deeply on course themes without feeling burdensome. This class was truly always the highlight of my week. |
| Just take it! There's no reason not to and you only have something to gain by doing so. Professor Perry is incredible and taking this course will help expand your understanding of the world around in ways that will change your life. The readings are interesting; the class discussion is engaging. Just take it |
| Professor Perry is an exceptional instructor, and class discussions are always engaging and exciting! Do be prepared to share the floor with graduate students, however, and don't expect to know what your grade is in the class, depending on the TF. |
| i would say that this class is very inspiring and worthwhile |
| It is worth taking this class! Dr. Perry cultivates great conversations and encourages thoughtful commentary among the community of learners present. It helps you consider another way to critically engage the world's presenting problems from a Black Feminist theory lens. |