Course Response Rate
| Raters | Students |
|---|---|
| Responded | 11 |
| Invited | 14 |
| Response Ratio | 79% |

Course General Questions
| Count | Excellent | Very Good | Good | Fair | Unsatisfactory | Course Mean | FAS Mean | |
|---|---|---|---|---|---|---|---|---|
| Evaluate the course overall. | 10 | 60% | 30% | 10% | 0% | 0% | 4.50 | 4.17 |
| Course materials (readings, audio-visual materials, textbooks, lab manuals, website, etc.) | 10 | 40% | 30% | 20% | 10% | 0% | 4.00 | 4.15 |
| Assignments (exams, essays, problem sets, language homework, etc.) | 10 | 50% | 20% | 30% | 0% | 0% | 4.20 | 4.00 |
| Feedback you received on work you produced in this course | 10 | 30% | 40% | 20% | 0% | 10% | 3.80 | 3.95 |
| Section component of the course | 2 | 50% | 0% | 50% | 0% | 0% | 4.00 | 4.10 |

General Instructor Questions
| Count | Excellent | Very Good | Good | Fair | Unsatisfactory | Instructor Mean | FAS Mean | |
|---|---|---|---|---|---|---|---|---|
| Evaluate your Instructor overall. | 10 | 60% | 30% | 10% | 0% | 0% | 4.50 | 4.48 |
| Gives effective lectures or presentations, if applicable | 10 | 50% | 30% | 20% | 0% | 0% | 4.30 | 4.36 |
| Is accessible outside of class (including after class, office hours, e-mail, etc.) | 10 | 60% | 20% | 10% | 10% | 0% | 4.30 | 4.35 |
| Generates enthusiasm for the subject matter | 10 | 70% | 30% | 0% | 0% | 0% | 4.70 | 4.52 |
| Facilitates discussion and encourages participation | 10 | 50% | 40% | 10% | 0% | 0% | 4.40 | 4.42 |
| Gives useful feedback on assignments | 10 | 40% | 20% | 10% | 20% | 10% | 3.60 | 4.35 |
| Returns assignments in a timely fashion | 9 | 44% | 11% | 11% | 11% | 22% | 3.44 | 4.39 |
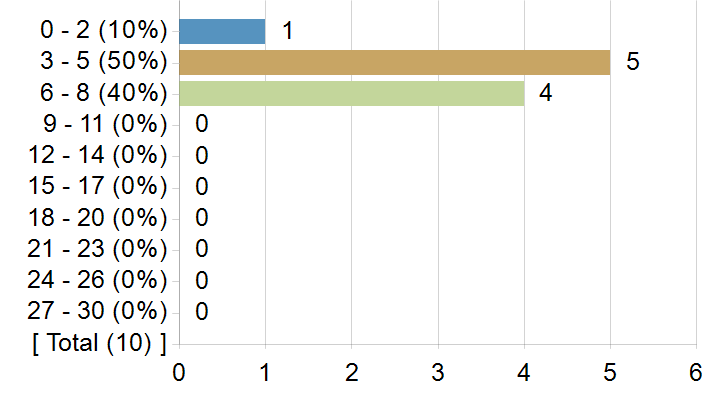
On average, how many hours per week did you spend on coursework outside of class? Enter a whole number between 0 and 168.
Frequency chart and mean excludes students who answered 31 or more hours.
On average, how many hours per week did you spend on coursework outside of class? Enter a whole number between 0 and 168.
| Statistics | Value |
|---|---|
| Response Count | 10 |
| Response Ratio | 71% |
| Mean | 5.40 |
| Median | 5.00 |
| Mode | 5, 8 |
| Standard Deviation | 2.12 |
How strongly would you recommend this course to your peers?
How strongly would you recommend this course to your peers?

| Options | Score | Count | Percentage |
|---|---|---|---|
| Recommend with Enthusiasm | 5 | 7 | 70% |
| Likely to Recommend | 4 | 2 | 20% |
| Recommend with Reservations | 3 | 0 | 0% |
| Unlikely to Recommend | 2 | 1 | 10% |
| Definitely not Recommend | 1 | 0 | 0% |
| Statistics | Value |
|---|---|
| Response Ratio | 71% |
| Mean | 4.50 |
| Median | 5.00 |
| Standard Deviation | 0.97 |
What was/were your reason(s) for enrolling in this course? (Please check all that apply)
| Options | Count |
|---|---|
| Elective | 6 |
| Concentration or Department Requirement | 4 |
| Secondary Field or Language Citation Requirement | 2 |
| Undergraduate General Education Requirement | 0 |
| Expository Writing Requirement | 0 |
| Foreign Language Requirement | 0 |
| Pre-Med Requirement | 0 |
| Divisional Distribution Requirement | 0 |
| Quantitative Reasoning with Data Requirement | 0 |
Comments from students
What would you like to tell future students about this class?
| Comments |
|---|
| Very relaxed class that is best if you are willing to go with the flow and allow Professor Kincaid lead you on a journey about writing and reading that is loose in structure but deep in content. |
| That the course is what you make of it. Do your best to complete the readings beforehand but also don't feel intimidated to speak up in class if you weren't able to get through everything and are still seeing some connections in the readings. Sharing out and discussing is most important in this process to cultivate your own tool for writing! |
| Take this course if you want to learn how to write. Everything else about is (beautiful) chaos, but it's an incredibly important space to help you work through your thoughts about your life, and not in a selfish or narcissistic way, but with other people who are also engaged in the project of trying to figure out what it means to live. |
| Very interesting! Class periods can run very long/drag on but only once a week so very manageable. DEFINITELY go to office hours and take advantage of Professor Kincaid's expertise. Will help you become a better writer/learn how to edit your memoir for the course. |
| Jamaica is amazing! you should really take a class with her! in this class, you'll write your own autobiography, and everyone will be really good at writing and you'll feel so intimidated and then you'll go to office hours and JK will make you feel like you, too, have a story to tell |
| This class is so much fun! Professor Kincaid is very approachable and encouraging. She just wants you to read and write and have fun with it. The readings were truly excellent and class discussions were fun. If you're looking for a relaxed environment that is also a great opportunity to improve your writing and engage with some interesting authors, this is the class for you! |