Course Response Rate
Table for Course Response Rate-2026 Spring Harvard FAS Course Evaluation.
| Responded | 9 |
| Invited | 15 |
| Response Ratio | 60% |
Course Feedback for AFRAMER 10
Course General Questions
|
Evaluate the course overall.
|
6 |
67% |
33% |
0% |
0% |
0% |
4.67 |
4.29 |
|
Course materials (readings, audio-visual materials, textbooks, lab manuals, website, etc.)
|
6 |
67% |
33% |
0% |
0% |
0% |
4.67 |
4.28 |
|
Assignments (exams, essays, problem sets, language homework, etc.)
|
6 |
33% |
33% |
17% |
17% |
0% |
3.83 |
4.15 |
|
Feedback you received on work you produced in this course
|
5 |
40% |
20% |
40% |
0% |
0% |
4.00 |
4.12 |
|
Section component of the course
|
6 |
50% |
0% |
33% |
17% |
0% |
3.83 |
4.28 |
Instructor Feedback for Jesse McCarthy
General Instructor Questions
| Evaluate your Instructor overall.
|
6 |
100% |
0% |
0% |
0% |
0% |
5.00 |
4.57 |
| Gives effective lectures or presentations, if applicable
|
6 |
100% |
0% |
0% |
0% |
0% |
5.00 |
4.48 |
| Is accessible outside of class (including after class, office hours, e-mail, etc.)
|
6 |
83% |
17% |
0% |
0% |
0% |
4.83 |
4.55 |
| Generates enthusiasm for the subject matter
|
5 |
100% |
0% |
0% |
0% |
0% |
5.00 |
4.63 |
| Facilitates discussion and encourages participation
|
6 |
83% |
0% |
17% |
0% |
0% |
4.67 |
4.60 |
| Gives useful feedback on assignments
|
5 |
60% |
40% |
0% |
0% |
0% |
4.60 |
4.53 |
| Returns assignments in a timely fashion
|
6 |
67% |
33% |
0% |
0% |
0% |
4.67 |
4.49 |
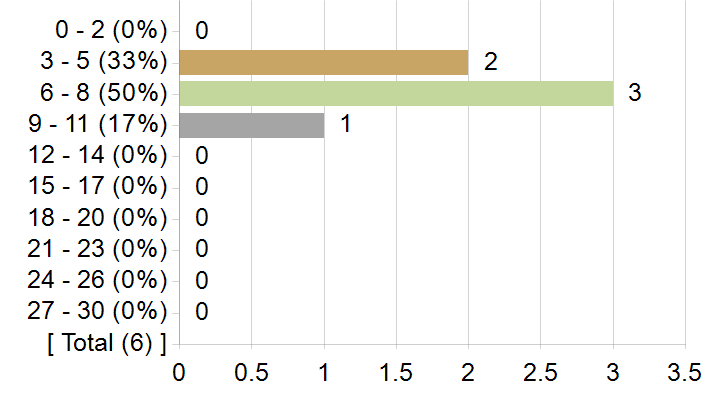
On average, how many hours per week did you spend on coursework outside of class? Enter a whole number between 0 and 30.
Frequency chart and mean excludes students who answered 31 or more hours.
On average, how many hours per week did you spend on coursework outside of class? Enter a whole number between 0 and 30.
Table for [QTitle]-On average, how many hours per week did you spend on coursework outside of class? Enter a whole number between 0 and 30. -Statistics.
| Response Count | 6 |
| Response Ratio | 40% |
| Mean | 6.17 |
| Median | 6.00 |
| Mode | 6 |
| Standard Deviation | 2.56 |
How strongly would you recommend this course to your peers?
How strongly would you recommend this course to your peers?
Table for [QTitle]- How strongly would you recommend this course to your peers? .
| Recommend with Enthusiasm | 5 | 4 | 67% |
| Likely to Recommend | 4 | 0 | 0% |
| Recommend with Reservations | 3 | 2 | 33% |
| Unlikely to Recommend | 2 | 0 | 0% |
| Definitely not Recommend | 1 | 0 | 0% |
Table for [QTitle]- How strongly would you recommend this course to your peers? -Statistics.
| Response Ratio | 40% |
| Mean | 4.33 |
| Median | 5.00 |
| Standard Deviation | 1.03 |
What was/were your reason(s) for enrolling in this course? (Please check all that apply)
Table for [QTitle].
| Elective | 3 |
| Concentration or Department Requirement | 2 |
| Secondary Field or Language Citation Requirement | 2 |
| Undergraduate General Education Requirement | 0 |
| Expository Writing Requirement | 0 |
| Foreign Language Requirement | 0 |
| Pre-Med Requirement | 0 |
| Divisional Distribution Requirement | 0 |
| Quantitative Reasoning with Data Requirement | 0 |
In this course, most students listen attentively with an open mind and a willingness to change their point of view as they learn more about the topic.
In this course, most students listen attentively with an open mind and a willingness to change their point of view as they learn more about the topic.
Table for [QTitle]-In this course, most students listen attentively with an open mind and a willingness to change their point of view as they learn more about the topic..
| Strongly Agree | 5 | 5 | 83% |
| Agree | 4 | 1 | 17% |
| Neither Agree nor Disagree | 3 | 0 | 0% |
| Disagree | 2 | 0 | 0% |
| Strongly Disagree | 1 | 0 | 0% |
Table for [QTitle]-In this course, most students listen attentively with an open mind and a willingness to change their point of view as they learn more about the topic.-Statistics.
| Response Ratio | 40% |
| Mean | 4.83 |
| Median | 5.00 |
| Standard Deviation | 0.41 |
In this course (including sections), I feel comfortable expressing my views on controversial topics.
In this course (including sections), I feel comfortable expressing my views on controversial topics.
Table for [QTitle]-In this course (including sections), I feel comfortable expressing my views on controversial topics..
| Strongly Agree | 5 | 4 | 67% |
| Agree | 4 | 2 | 33% |
| Neither Agree nor Disagree | 3 | 0 | 0% |
| Disagree | 2 | 0 | 0% |
| Strongly Disagree | 1 | 0 | 0% |
Table for [QTitle]-In this course (including sections), I feel comfortable expressing my views on controversial topics.-Statistics.
| Response Ratio | 40% |
| Mean | 4.67 |
| Median | 5.00 |
| Standard Deviation | 0.52 |
Comments from students
What would you like to tell future students about this class? (Your response to this question may be published anonymously.)