Course Response Rate
| Raters | Students |
|---|---|
| Responded | 24 |
| Invited | 25 |
| Response Ratio | 96% |

Course General Questions
| Count | Excellent | Very Good | Good | Fair | Unsatisfactory | Course Mean | FAS Mean | |
|---|---|---|---|---|---|---|---|---|
| Evaluate the course overall. | 23 | 65% | 26% | 9% | 0% | 0% | 4.57 | 4.17 |
| Course materials (readings, audio-visual materials, textbooks, lab manuals, website, etc.) | 23 | 70% | 26% | 0% | 4% | 0% | 4.61 | 4.15 |
| Assignments (exams, essays, problem sets, language homework, etc.) | 23 | 48% | 39% | 13% | 0% | 0% | 4.35 | 4.00 |
| Feedback you received on work you produced in this course | 23 | 48% | 30% | 17% | 4% | 0% | 4.22 | 3.95 |
| Section component of the course | 23 | 83% | 13% | 4% | 0% | 0% | 4.78 | 4.10 |

General Instructor Questions
| Count | Excellent | Very Good | Good | Fair | Unsatisfactory | Instructor Mean | FAS Mean | |
|---|---|---|---|---|---|---|---|---|
| Evaluate your Instructor overall. | 21 | 67% | 19% | 14% | 0% | 0% | 4.52 | 4.48 |
| Gives effective lectures or presentations, if applicable | 21 | 57% | 29% | 5% | 10% | 0% | 4.33 | 4.36 |
| Is accessible outside of class (including after class, office hours, e-mail, etc.) | 20 | 75% | 15% | 5% | 5% | 0% | 4.60 | 4.35 |
| Generates enthusiasm for the subject matter | 21 | 81% | 19% | 0% | 0% | 0% | 4.81 | 4.52 |
| Facilitates discussion and encourages participation | 20 | 75% | 20% | 5% | 0% | 0% | 4.70 | 4.42 |
| Gives useful feedback on assignments | 18 | 50% | 33% | 11% | 6% | 0% | 4.28 | 4.35 |
| Returns assignments in a timely fashion | 18 | 33% | 28% | 33% | 6% | 0% | 3.89 | 4.39 |
On average, how many hours per week did you spend on coursework outside of class? Enter a whole number between 0 and 168.
Frequency chart and mean excludes students who answered 31 or more hours.
On average, how many hours per week did you spend on coursework outside of class? Enter a whole number between 0 and 168.
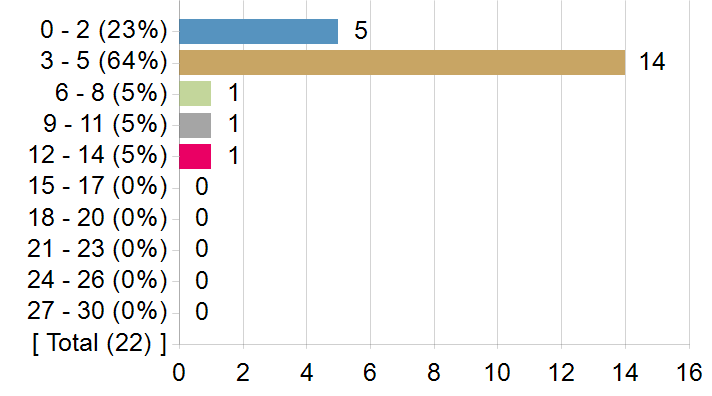
| Statistics | Value |
|---|---|
| Response Count | 22 |
| Response Ratio | 88% |
| Mean | 4.09 |
| Median | 3.50 |
| Mode | 3 |
| Standard Deviation | 2.56 |
How strongly would you recommend this course to your peers?
How strongly would you recommend this course to your peers?

| Options | Score | Count | Percentage |
|---|---|---|---|
| Recommend with Enthusiasm | 5 | 15 | 65% |
| Likely to Recommend | 4 | 6 | 26% |
| Recommend with Reservations | 3 | 2 | 9% |
| Unlikely to Recommend | 2 | 0 | 0% |
| Definitely not Recommend | 1 | 0 | 0% |
| Statistics | Value |
|---|---|
| Response Ratio | 92% |
| Mean | 4.57 |
| Median | 5.00 |
| Standard Deviation | 0.66 |
What was/were your reason(s) for enrolling in this course? (Please check all that apply)
| Options | Count |
|---|---|
| Elective | 15 |
| Concentration or Department Requirement | 5 |
| Secondary Field or Language Citation Requirement | 7 |
| Undergraduate General Education Requirement | 0 |
| Expository Writing Requirement | 0 |
| Foreign Language Requirement | 0 |
| Pre-Med Requirement | 1 |
| Divisional Distribution Requirement | 1 |
| Quantitative Reasoning with Data Requirement | 0 |
Comments from students
What would you like to tell future students about this class?
| Comments |
|---|
| Everybody should definitely lottery for this class – especially if you're a guy, cause though you'll likely be super uncomfortable at first, you'll learn a ton. It's fr one of the top 3 classes I've taken at Harvard – thought–provoking/eye–opening, quality assignments, not too much work, meets only once a week + section, fair grading. |
| I think any class that takes the time to try and give a platform to Black womens voices in a space like Harvard is really important. When understanding the voices of Black women there are inherently going to be numerous conversations around sexual assault and I do think you have to be mentally and sometimes physically prepared for that element of the course. You should also know that just because its a course about pain that you don't have to perpetually share that pain. The assignments are relatively easy and gives you the space to engage with the books in whatever way is beneficial to you. Just make sure you're always analyzing the text (this becomes key for your grade). |
| This is a really good space to feel heard and affirmed as a person marginalized by the topics in the class. For those outside of those experiences, this is a really great course to learn about the intersectional issues that plague Black women. |
| The syllabus for this course is unmatched and it is really great to talk about issues relating specifically to black women in a academic setting. That being said some classes and topics covered can be heavy so you gotta be prepared for that |
| PLEASE PLEASE PLEASE take this course!! It's important to educate yourself about the reality of the #MeToo movement beyond what social media has presented with the Harvey Weinstein case. Dr. Chavers provides an excellent platform for having difficult conversations in a safe and open space. It feels like a necessary course for every student to take. You learn a lot about how you have an impact on the injustices going on in the world, and how silence only allows the problem to continue. |
| Absolutely life–changing, made me think about race, gender and the intersection of the two so deeply. Incredibly fruitful discussions week after week that made me excited to attend class. |
| Students should know that you deal with heavy, triggering material and as a POC coming to class can sometimes be difficult. |
| I would love to tell students that the professor is so very passionate, but until the course load becomes more cohesive you may not get everything out of it that you have imagined |
| Great great class! definitely take it. workload isn't too crazy and there is no final. dr. chavers is great and you always leave class discussion learning something new. definitely have a new outlook because of this class. |
| Interesting course. Potentially triggering |
| Dr. Chavers is AMAZING and a PURE GEM AT HARVARD! This is literally the best and most important class to take here at Harvard. I had never read a slave narrative or knew much about the #MeToo movement when I entered this class. As someone who does not identify as a black woman, I felt that this class was important to take to understand the intersectionality between race and gender within the U.S. dating back to slavery and its connection with the modern day. While the class is not a "gem," it is worthwhile to take. The reading is heavy at times but compared to other courses, it is actually interesting and part of the discussion every week. The assignments are super flexible and allow you to voice your thoughts, engage in a conversation without judgment, and even challenge yourself to write a blog post. A MUST TAKE!! Warning: this class does discuss issues of sexual assault and at times, this topic was heavy. But Dr. Chavers made the classroom a safe space where all students could openly discuss these issues in a way that felt therapeutic (and sometimes even better than therapy). |
| super interesting, very relevant to today |
| Take this class if you are looking to understand the dynamics of how blackness and feminity operate in America's traditional institutions of power. |
| Are you a woman? Take the class! Are you a PoC? Take the class! Are you queer? Take the class! Are you all three of these? Take the class! Are you none of these? You really need to take this class. I mean it. |
| This course is the most real and grounded in the present of any class I've taken. You'll talk and read about the things we're seeing on the news in conjunction with 19th century memoir and 20th century fiction, and it's both fascinating and tragic how we see the same things over and over again. Dr. Chavers is passionate about these topics and so are the students. You'll have difficult, uncomfortable, and probably personal discussions, so be prepared for this class to be not just academic, but personal and emotional as well. |
| This class is amazing! If you want to challenge yourself, read important texts, think analytically, and learn to engage critically with media this class is perfect. I truly learned so much from the course material, my fellow classmates, and the amazing teaching staff. Professor Chavers and Emma are so dedicated and passionate. |