Course Response Rate
| Raters | Students |
|---|---|
| Responded | 10 |
| Invited | 10 |
| Response Ratio | 100% |

Course General Questions
| Count | Excellent | Very Good | Good | Fair | Unsatisfactory | Course Mean | FAS Mean | |
|---|---|---|---|---|---|---|---|---|
| Evaluate the course overall. | 9 | 78% | 22% | 0% | 0% | 0% | 4.78 | 4.26 |
| Course materials (readings, audio-visual materials, textbooks, lab manuals, website, etc.) | 9 | 89% | 11% | 0% | 0% | 0% | 4.89 | 4.24 |
| Assignments (exams, essays, problem sets, language homework, etc.) | 9 | 67% | 11% | 11% | 0% | 11% | 4.22 | 4.14 |
| Feedback you received on work you produced in this course | 9 | 56% | 33% | 11% | 0% | 0% | 4.44 | 4.14 |
| Section component of the course | 2 | 100% | 0% | 0% | 0% | 0% | 5.00 | 4.29 |

General Instructor Questions
| Count | Excellent | Very Good | Good | Fair | Unsatisfactory | Instructor Mean | FAS Mean | |
|---|---|---|---|---|---|---|---|---|
| Evaluate your Instructor overall. | 7 | 71% | 29% | 0% | 0% | 0% | 4.71 | 4.54 |
| Gives effective lectures or presentations, if applicable | 7 | 86% | 14% | 0% | 0% | 0% | 4.86 | 4.46 |
| Is accessible outside of class (including after class, office hours, e-mail, etc.) | 7 | 57% | 14% | 14% | 14% | 0% | 4.14 | 4.52 |
| Generates enthusiasm for the subject matter | 7 | 100% | 0% | 0% | 0% | 0% | 5.00 | 4.61 |
| Facilitates discussion and encourages participation | 7 | 71% | 29% | 0% | 0% | 0% | 4.71 | 4.59 |
| Gives useful feedback on assignments | 7 | 43% | 29% | 29% | 0% | 0% | 4.14 | 4.52 |
| Returns assignments in a timely fashion | 7 | 29% | 57% | 14% | 0% | 0% | 4.14 | 4.49 |
On average, how many hours per week did you spend on coursework outside of class? Enter a whole number between 0 and 168.
Frequency chart and mean excludes students who answered 31 or more hours.
On average, how many hours per week did you spend on coursework outside of class? Enter a whole number between 0 and 168.
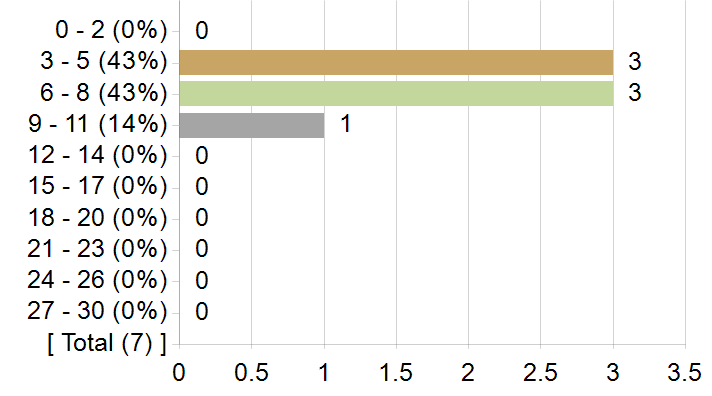
| Statistics | Value |
|---|---|
| Response Count | 7 |
| Response Ratio | 70% |
| Mean | 6.00 |
| Median | 6.00 |
| Mode | 3 |
| Standard Deviation | 2.58 |
How strongly would you recommend this course to your peers?
How strongly would you recommend this course to your peers?

| Options | Score | Count | Percentage |
|---|---|---|---|
| Recommend with Enthusiasm | 5 | 8 | 89% |
| Likely to Recommend | 4 | 1 | 11% |
| Recommend with Reservations | 3 | 0 | 0% |
| Unlikely to Recommend | 2 | 0 | 0% |
| Definitely not Recommend | 1 | 0 | 0% |
| Statistics | Value |
|---|---|
| Response Ratio | 90% |
| Mean | 4.89 |
| Median | 5.00 |
| Standard Deviation | 0.33 |
What was/were your reason(s) for enrolling in this course? (Please check all that apply)
| Options | Count |
|---|---|
| Elective | 5 |
| Concentration or Department Requirement | 4 |
| Secondary Field or Language Citation Requirement | 2 |
| Undergraduate General Education Requirement | 0 |
| Expository Writing Requirement | 0 |
| Foreign Language Requirement | 0 |
| Pre-Med Requirement | 0 |
| Divisional Distribution Requirement | 0 |
| Quantitative Reasoning with Data Requirement | 0 |
In this course, most students listen attentively with an open mind and a willingness to change their point of view as they learn more about the topic.
In this course, most students listen attentively with an open mind and a willingness to change their point of view as they learn more about the topic.

| Options | Score | Count | Percentage |
|---|---|---|---|
| Strongly Agree | 5 | 9 | 100% |
| Agree | 4 | 0 | 0% |
| Neither Agree nor Disagree | 3 | 0 | 0% |
| Disagree | 2 | 0 | 0% |
| Strongly Disagree | 1 | 0 | 0% |
| Statistics | Value |
|---|---|
| Response Ratio | 90% |
| Mean | 5.00 |
| Median | 5.00 |
| Standard Deviation | 0.00 |
In this course (including sections), I feel comfortable expressing my views on controversial topics.
In this course (including sections), I feel comfortable expressing my views on controversial topics.

| Options | Score | Count | Percentage |
|---|---|---|---|
| Strongly Agree | 5 | 8 | 89% |
| Agree | 4 | 0 | 0% |
| Neither Agree nor Disagree | 3 | 1 | 11% |
| Disagree | 2 | 0 | 0% |
| Strongly Disagree | 1 | 0 | 0% |
| Statistics | Value |
|---|---|
| Response Ratio | 90% |
| Mean | 4.78 |
| Median | 5.00 |
| Standard Deviation | 0.67 |
Comments from students
What would you like to tell future students about this class? (Your response to this question may be published anonymously.)
| Comments |
|---|
| Definitely take this class! Sarah Lewis is a great teacher and you will learn so much for her. The small class made it so that every conversation felt unique and important and everyone was engaged. |
| I loved this class! Professor Lewis knows so much and is genuinely so excited about the material. I would highly recommend taking it as a seminar – you get to talk directly with Professor Lewis and she really is excited about hearing the ideas of the students. All of the material is so interesting as well – if you have any interest in art, social justice, etc. I highly recommend this class I guarantee you will just really come to love art even more. |
| I found this class to be fascinating. The subject and the materials were fantastic. If it were slightly more organized it would be a perfect class, but the syllabus was often subject to change and there was a general lack of clarity on assignments. I loved the class and I'm very glad I took it, but it might not be for everyone. I would not recommend this course for people who have not taken many seminars before. |
| This was a really insightful and educational course! I will say, it can get repetitive at times, so I highly recommend doing the readings because that is where you will be doing most of the learning. Response papers were also added half way through the course which was surprising and definitely added work, so be aware. |
| I think if you have ever wondered whether art can be used as effective protest you should take this class. Our work engaged with some of the most foundational images that have been ingrained in the American consciousness for centuries, and interrogating those origins is also incredibly valuable (ie the Vanishing Race theory or parts of the Capitol). Professor Lewis is also insanely smart and you should take advantage of the opportunity to learn from her. |
| There was very limited information about this class going into it so I didn't fully know what to expect. Overall, I really enjoyed this class and am glad that I took it. The class is focused on how racial hierarchies are created and perpetuated through art. It will expose you to dark truths that America often tries to ignore. I loved the lessons on art and indigenous Americans and art and the Japanese intonement and wish that there was more time spent focusing on this throughout the course. I would recommend this course to any student who is interested in the African American experience and race studies through an art history lens. Sometimes I felt the course was a little repetitive however Professor Lewis is a very caring lecturer who really takes the time to understand her students. I really appreciated how each class began with time sharing what we were grateful for that week. There was a lot of flexibility in the final project which was great for exploring. |
| This class was so amazing. Having it in a seminar format made it possible for us to have deep and engaging discussions. The content of the class is so important to understanding the history of art, race, and politics. I learned something new each and every week and will carry it with me forever. Professor Lewis is doing such important work outside of the classroom as well, and it was an honor to take in her ideas and analysis. She cares about all of her students and is committed to their success. Please take this course! I can't recommend it enough. |