Course Response Rate
| Raters | Students |
|---|---|
| Responded | 128 |
| Invited | 166 |
| Response Ratio | 77% |

Course General Questions
| Count | Excellent | Very Good | Good | Fair | Unsatisfactory | Course Mean | FAS Mean | |
|---|---|---|---|---|---|---|---|---|
| Evaluate the course overall. | 119 | 28% | 35% | 28% | 7% | 3% | 3.79 | 4.17 |
| Course materials (readings, audio-visual materials, textbooks, lab manuals, website, etc.) | 116 | 27% | 39% | 23% | 7% | 4% | 3.77 | 4.15 |
| Assignments (exams, essays, problem sets, language homework, etc.) | 117 | 25% | 32% | 27% | 11% | 5% | 3.60 | 4.00 |
| Feedback you received on work you produced in this course | 115 | 26% | 30% | 19% | 17% | 8% | 3.50 | 3.95 |
| Section component of the course | 114 | 29% | 25% | 21% | 14% | 11% | 3.48 | 4.10 |

General Instructor Questions
| Count | Excellent | Very Good | Good | Fair | Unsatisfactory | Instructor Mean | FAS Mean | |
|---|---|---|---|---|---|---|---|---|
| Evaluate your Instructor overall. | 70 | 40% | 27% | 23% | 7% | 3% | 3.94 | 4.48 |
| Gives effective lectures or presentations, if applicable | 69 | 39% | 17% | 26% | 14% | 3% | 3.75 | 4.36 |
| Is accessible outside of class (including after class, office hours, e-mail, etc.) | 59 | 20% | 14% | 19% | 27% | 20% | 2.86 | 4.35 |
| Generates enthusiasm for the subject matter | 69 | 51% | 23% | 19% | 6% | 1% | 4.16 | 4.52 |
| Facilitates discussion and encourages participation | 42 | 36% | 14% | 31% | 10% | 10% | 3.57 | 4.42 |
| Gives useful feedback on assignments | 17 | 53% | 6% | 18% | 12% | 12% | 3.76 | 4.35 |
| Returns assignments in a timely fashion | 20 | 45% | 10% | 15% | 20% | 10% | 3.60 | 4.39 |
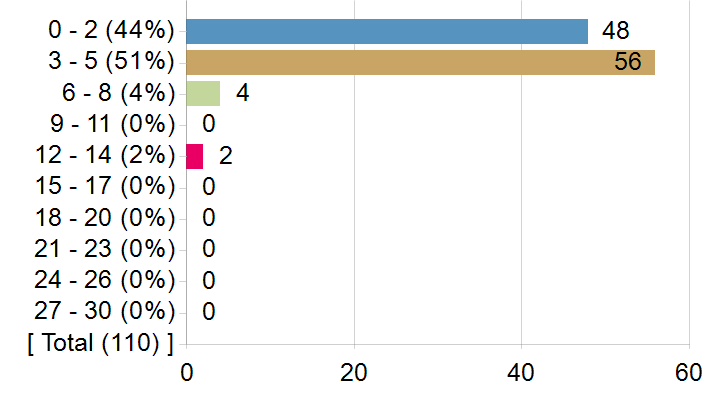
On average, how many hours per week did you spend on coursework outside of class? Enter a whole number between 0 and 168.
Frequency chart and mean excludes students who answered 31 or more hours.
On average, how many hours per week did you spend on coursework outside of class? Enter a whole number between 0 and 168.
| Statistics | Value |
|---|---|
| Response Count | 110 |
| Response Ratio | 66% |
| Mean | 3.01 |
| Median | 3.00 |
| Mode | 2 |
| Standard Deviation | 1.81 |
How strongly would you recommend this course to your peers?
How strongly would you recommend this course to your peers?

| Options | Score | Count | Percentage |
|---|---|---|---|
| Recommend with Enthusiasm | 5 | 37 | 32% |
| Likely to Recommend | 4 | 44 | 38% |
| Recommend with Reservations | 3 | 25 | 22% |
| Unlikely to Recommend | 2 | 6 | 5% |
| Definitely not Recommend | 1 | 4 | 3% |
| Statistics | Value |
|---|---|
| Response Ratio | 70% |
| Mean | 3.90 |
| Median | 4.00 |
| Standard Deviation | 1.02 |
What was/were your reason(s) for enrolling in this course? (Please check all that apply)
| Options | Count |
|---|---|
| Elective | 71 |
| Concentration or Department Requirement | 20 |
| Secondary Field or Language Citation Requirement | 45 |
| Undergraduate General Education Requirement | 2 |
| Expository Writing Requirement | 0 |
| Foreign Language Requirement | 0 |
| Pre-Med Requirement | 1 |
| Divisional Distribution Requirement | 12 |
| Quantitative Reasoning with Data Requirement | 0 |
Comments from students
What would you like to tell future students about this class?
| Comments |
|---|
| The class is good and really informative, but as a POC you will feel a bit frustrated because a lot of the material is clearly catered to white people. |
| A lovely and pertinent class with a brilliant and talented professor. |
| This class is not time intensive and the work is very fair. The book reports were actually fun, in my opinion, as the books were eye–opening. My TF, Aparna, graded the book reports/paper quite difficult, but I know other TFs, like Paul, were more lenient. |
| This course lectures are very boring. Like very boring. But the class isn’t hard itself, it’s just very frustrating because the course is pretty much going to rely on your tf. Aparna wasn’t great, she wasn’t super ready for sections and graded tough, but other sections had really planned out sections and grading was a bit more lenient so it’s a risk. I would just take another course instead honestly. |
| Interesting content in a manageable workload |
| The course overall is wonderful but for the assigned essay you need to make sure you completely understand what your TF wants in terms of details. |
| Very easy course, interesting subject material, and the course does a good job in persuading you of the tremendous adverse effects that being poor or nonwhite have on one's health in America. Lectures and readings get v repetitive and section can be dry if ppl aren't engaged. |
| Easy if you're interested |
| the class had all the potential energy of AFAM 10 for black students but fell short in the administrative aspect being that prof williams and the TFs did not execute it in the best way. Papers were timed at inopportune times (thanksgiving break) along with in class assignments which he had the power to move to accommodate |
| This class gives what you put into it: if you do the readings you will learn a lot, otherwise you might not learn much. The biggest assignments are three book reviews which are not difficult at all unless you don’t read the books. |
| The grade you receive largely depends on the TF since there are only essays. |
| I would recommend this course if you have no baseline knowledge of health inequities/racial injustices occurring in this nation. If you are aware of these things, this could be an easy course or like me you will feel that this was a waste of your time |
| Take this class. Professor Williams is so engaging and very kind. The teaching staff is also great. I had Elsa and she was receptive and competent. I took this class as a 5th class and it was one of the best decisions I've made. The only downside is that they take attendance at every lecture and section so make sure you can make it to both. |
| The lectures are not engaging at all. There is one lecture a week but it can be upwards of 3 hours long. The Professor seems to repeat himself often or at least repeat general themes. Sometimes he includes documentaries, some which are interesting, others which are a bore. |
| Gem. |
| This class is great. Professor Williams is so knowledgeable on the material and the class touches on many important concepts. There is not too much work and lecture once a week is such a move. Take this class! |
| The good: This class teaches very important lessons about the reality of health and race/socioeconomic status. The workload is light. The bad: The material from this class gets a bit repetitive. Half of the class doesn't pay attention during lectures and it can be an irritating environment to be in. 90% of all readings were by Dr. Williams (actually unsure if that's good or bad). The weekly quizzes are a pain. The prompts for the book report are very unclear. |
| You're going to learn a lot of new things about the relations between poverty, race, and health |
| Take this class. It's eye–opening. It reveals a lot of facts about life I was unaware of. Lectures are super engaging and interesting; Professor Williams is an incredibly interesting professor. |
| The class is a little repetitive but very interesting. |
| Straight up GEM. Incredibly easy, but super interesting material. Professor Williams is interesting, smart, and cool. |
| This is a good introductory class to race and poverty, but if you have prior academic experience with those two topics, don't expect any mind–blowing lectures. Most of the lectures seemed surface–level, especially since they repeated much of the information found in the readings. |
| Do NOT take this course! The class does not allow extensions on paper assignments and several quiz questions are designed to trick you based on subtleties in word choice. Not a very student–friendly class! |
| Good course. |
| Don't bother with this class. The first day will persuade you that this will be a great class. Seriously save your time. Take Death by Design, another sociology course instead. The lectures drag on forever. For the book reviews, there's no real rubric for the essays, and its all dependent on your TF's interoperation of the assignment. Some TFs were giving A's on essays that my classmates admitted to only spending like 3 hours on that they knew were bad. Meanwhile, other TF's were going hardcore and giving Bs or less. |
| Your grade will reflect the work you put into the course, but, overall, it is a very interesting course, and the entire teaching staff is great... books are readable too |
| a very good class with useful and important material. will make you see america in a new way. |
| This is a great class, it can be boring at times. However, it is very manageable and the course content has real implications on our lives. |
| The class introduces some important discussion on poverty and racism in the United States and doesn't take a lot of time. However, the lectures are too long and some of the discussion remain pretty superficial. |
| Excellent professor, fair amount of interesting weekly readings, great selection of books |
| It's not too difficult, but make sure you take the time to wrestle with the themes and topics you're learning about. It's pretty interesting, but not too much work. |
| This class was awesome! So much of the information useful in everyday life. Definitely a must take course (that won't stress you out too!) |
| Try and avoid Tadiwa as a TF and meet with your TF about the book reports before they are due |
| a true gem |
| This class is pretty easy and has a light work load throughout the semester. Weekly quizzes and attendance make up almost half of your grade, which is super nice. While the content is something that I am super interested in, it began to drag and become slightly repetitive about a quarter into the semester. |
| Its interesting but only informative if you do the readings. |
| This class is low–time commitment, low–work involved. It attracts a lot of people who have no intention of diving into the course material and who are simply looking for an easy class. That is awful given the importance of the course material which related to such powerful topics such as poverty, racism, and health inequity. You get out of this class what you put in, but it's an unmotivating environment so truly how much effort you put in is up to you. |
| Huge gem was able to get it moved to a take home final and it was great. Lectures are mandatory and long but you can figure out how to get through it |
| The work load is light and the material interesting |
| great class overall! |
| I don't know that I would call this class a gem, but it is interesting. You won't leave the class thinking about wealth and race in America in the same way. However, the lectures can be dry, and VERY repetitive. I would say you could reduce the lectures in this class about half. However, the papers are not graded harshly and the weekly quizzes are easy. Definitely take if you are interested in the subject, but don't take just as a filler class, you will be bored. |
| It's an okay class but if you have any knowledge about racial disparity in America then it's not very enlightening. section is hit or miss and lectures are so boring. |
| Learn a ton, chill a lot. There are so many valuable things in this course, and it's the rare type to not kill you with stress in the process. I enjoy this course for the breadth it covers, including touching on Native people in this country. The books are also interesting even though one has unethical practices, you get to engage with all of this. Would take this again if I had to choose. |
| Awesome course. Professor Williams is amazing. Workload is easy to balance and the books/assignments are actually very great. Lectures are long but fascinating and you will learn so much in this class. Important information about the world and about health that everyone should be required to know. |
| This class involves a light workload with very interesting and relevant reading material. Lecture and section are mandatory but only meet once a week. Books are very good and the book reports are very manageable. You will get out of this class what you put into it. |
| Great course, do the assignments and all will be well. |
| It's great. |
| This course is a must take for anyone remotely interested in healthcare, health policy, and health disparities. Dr. Williams is such a caring, engaging professor and is literally at the top of his field. This course is insanely informative and will open your eyes to many interlocking historical and contemporary mechanisms that influence health disparities for minorities. It will change the way you think about health policy. Section is open and engaging, and the TFs are amazing. Workload is manageable. |
| I felt that the material in this class was really important and interesting. Although the lectures are a bit dull at times, it is a very low intensity, easy class that you can do well in if you complete the assignments. Good gen ed with not too much time commitment and an important subject, especially for pre–meds. |
| Not a lot of work you can go without doing any of the readings the only real assignments are the book reports. |
| The class has very interesting/important content to learn. |
| The course is super relevant and touches on a lot of important topics. Can feel very similar to some other global health courses if you’ve taken them, but still super important. |
| The class is great, but lectures can be somewhat heard to get through because of the formatting and the length of lectures |
| Take this class!!! You will learn about the ways in which health is unfortunately largely affected by one's race, socioeconomic status, and resources. Not only does this class provide sometimes sad and very startling information on the ways in which racism today continues to impact health, even for the wealthy who come from marginalized communities, it shows you how to begin to think about fixing those issues. With the inclusion of successful interventions at the end of each lecture, it allows you to see how the information on health disparities can be applied to crafting solutions and helping people overcome these barriers to health. If you are at all passionate about making a change in health not only in America but around the world, take this class! |
| This course is great if you have a heavy course load. The books are really interesting and the final project is pretty easy if you think you'll be having a tough finals week. The class can become repetitive and the take–home message will be, for every class, that your race defines your level of health in the US. |
| This class is incredible and should be mandatory to students interested in alleviating inequalities in healthcare and health outcomes. |
| If you're interested in getting a much deeper understanding of health and how it's affected by social factors like race and socioeconomic status then this course could be a good fit. I will say that this year the class structure definitely needed some work (lecture was too long, deadlines weren't very clear) so hopefully that's adjusted before fall 2020. |
| This course covers really important topics and is taught by a leader in the field. I think if you're premed or especially if you're interested in public health this is a great course to take. The lecture style is kind of really brutal but it's not a big time commitment. |
| Pretty chill class. Seems like grading depends on your TF. If your interest in health disparities in the US, def take this. |
| very interesting course material. you can get away without really doing the readings, but you should still do them |
| Great class. Timing is great and lecture isn't bad at all. Assignments are pretty light as well, spread out and the three reports are 4 pages each. Make sure you do well on the quizzes |
| Really interesting class, and when it gets boring you can use you computer which is nice. Assignments aren't too difficult, but grading varies by your TF. Overall enjoyed the class and learned a lot |
| Definitely take this class! It's informative, Professor Williams is engaging and structures the class well. Also very light workload. One of my favorite courses so far. |
| This class is a very interesting class with a student friendly grading scheme. However, beware the really long lectures and the books one might have to read for the course. The 3 hour lectures may turn you off and so might Nickel and Dimed, but overall this course was very powerful and taught me a lot about the inner workings of racism and discrimination in America. |
| Take this class! It’s more on black–white health disparities (rather than focusing on health disparities for the LatinX, Asian, and Native American communities which was kind of disappointing for me). There’s one three hour lecture a week, one at home open note reading quiz per week, and three four page papers on pretty interesting books. Super manageable, and you’ll learn a lot about real world examples, legislation, and non–profits confronting health disparities. |
| Class is super engaging and very relevant to todays world. |
| Strong course, but I felt that it could be organized better and assignments could be explained more to students, especially with the book review assignments. |
| This was a great class. The content is interesting, the professor is a leader in the field, and my experiences with the class sections was great. The readings/content do get a little repetitive though and they are pretty strict about attendance and gave people a lot of trouble (extra papers/penalties) for joining the class late, which seemed pretty ridiculous to me. |
| Take a different course if you want to get the most out of your fourth class, but could be good as a 5th class. Lectures are great, the assignments don't relate however and there is little guidance on how to complete them before they are given out. Grading is fairly easy, but can also be very subjective so be weary of that. |
| This class is very interesting but very statistics based with few applications. I wish that the course had students do more actively engaged projects rather than just book reviews, so we could come up with real health policy solutions. I also wish that the books were chosen with more of a focus as they seemed to be a bit all over the place. It is not a challenging course, but I just feel like it has so much potential to be extremely interesting, but misses that mark due to these factors. |
| This class was literally so easy. I recommend taking with friends because that is what made it more enjoyable. The weekly online quizzes are super easy and straightforward and you don't even have to do the readings every week. I spent very little time doing the readings and was able to do the quizzes anyways. The section component of this class didn't start until one or two months into the semester and felt kind of like a waste of time, but honestly totally worth the very minimum workload. There were three 4 page book reviews during the assignment and a 7 page paper as a take home final. Make sure to say you want a take home final when Professor Williams asks. 10/10 would recommend if you are looking to take an easy class to fulfill the social science or GHHP requirement. |
| Lectures can get a bit dry, but is a good course to learn about the different types of disparities in health, wealth, education, etc. |
| Be very intentional about your section leader and you will most likely do fine. It's a large lecture class so it doesn't really break from many of those expectations. |
| This class is one of the few I've found that gets at the intersection of race/ethnicity/class and health. If you are an upperclassmen and have taken some courses on AAAS/sociology some of the information may not be new to you, but you will still learn a lot and learn new skills for addressing race and health disparities. I think this class would have the most impact if you are earlier in your college career or are unfamiliar with AAAS, but this class was still enjoyable and taught me many things. |
| Lectures are extremely long. Section is helpful for understanding what is going on. Form a group chat with classmates immediately. |
| Most boring class at Harvard |
| If you are interested in health disparities and how they are the result of race and socioeconomic status, this is the class for you. The readings get a little redundant but overall I feel like I learned a lot from this class and I'm glad I took it. |
| This class is generally very low stress, but you learn a lot and are exposed to many important studies that provide interventions to reduce disparities in health. |
| Williams is great |
| Start book reports early and establish a good relationship with your TF because your grade depends on them. |
| This is an interesting gem course that is great for students interested in social medicine. There is not much course work besides weekly reading quizzes and the three book reports. Prof. Williams is a great lecturer and it was a worthwhile class. |
| Very much enjoyed this course and what I learned. Though some things were obvious, coming from a low–income background, there were a lot os issues I myself was not aware of because I never really knew about them growing up. I also enjoyed most of the books we had to read for this class. |
| Lectures can be a little dry |
| This class is very chill overall, although I would say that the class itself is pretty boring. The subject matter is super interesting, but the way that it's presented in lecture gets to be very repetitive (He essentially just presents data every lecture). I would take it if you're interested in learning about racial health disparities and want a chill fourth class. The assignments are doable and the books were interesting, although we never actually talked about them in class. |
| This course does not take a lot of effort. However, the lectures are incredibly long and it is difficult to pay attention. The grading of the book reviews is very dependent on your TF, and the book reviews are about race and poverty separately but do not deal with health. Overall, the course is a good course and I did learn about social determinants of health. |
| Great class |
| Very low–workload. Go to lecture and take some good note. Take the reading quizzes seriously because bad grades can easily pile up. READ THE BOOKS that way you can do your Book Review well. |
| It's a relatively easy course but I can't say I learned much and the Professor needs to really update the course materials. |
| This is a very informative class on an extremely important subject! It should be required for all pre–meds (if not all students) to take. The workload is not too high, but the material is still intellectually engaging. Section can be hit or miss, but your grade is based on attendance rather than participation, so it's not a huge deal. |
| The subject is eye–opening and it challenges your assumptions about poverty and racism. The latter two books we read were so powerful and enlightening that I would read them again. The professor is very knowledgeable and is a big shot in his field. This might be why he is so lax and instructs in a way that's like 'understanding the bitter truth of racism and inequality is more important than doing class assignments'. On top of that, the course is a breeze. I only wish I took this course when I had a harder semester. |