Course Response Rate
| Raters | Students |
|---|---|
| Responded | 18 |
| Invited | 24 |
| Response Ratio | 75% |

Course General Questions
| Count | Excellent | Very Good | Good | Fair | Unsatisfactory | Course Mean | FAS Mean | |
|---|---|---|---|---|---|---|---|---|
| Evaluate the course overall. | 17 | 59% | 35% | 6% | 0% | 0% | 4.53 | 4.21 |
| Course materials (readings, audio-visual materials, textbooks, lab manuals, website, etc.) | 16 | 81% | 13% | 6% | 0% | 0% | 4.75 | 4.20 |
| Assignments (exams, essays, problem sets, language homework, etc.) | 16 | 63% | 38% | 0% | 0% | 0% | 4.63 | 4.07 |
| Feedback you received on work you produced in this course | 16 | 69% | 25% | 0% | 6% | 0% | 4.56 | 4.08 |
| Section component of the course | 3 | 100% | 0% | 0% | 0% | 0% | 5.00 | 4.22 |

General Instructor Questions
| Count | Excellent | Very Good | Good | Fair | Unsatisfactory | Instructor Mean | FAS Mean | |
|---|---|---|---|---|---|---|---|---|
| Evaluate your Instructor overall. | 16 | 88% | 6% | 6% | 0% | 0% | 4.81 | 4.51 |
| Gives effective lectures or presentations, if applicable | 16 | 100% | 0% | 0% | 0% | 0% | 5.00 | 4.39 |
| Is accessible outside of class (including after class, office hours, e-mail, etc.) | 16 | 88% | 13% | 0% | 0% | 0% | 4.88 | 4.44 |
| Generates enthusiasm for the subject matter | 16 | 94% | 6% | 0% | 0% | 0% | 4.94 | 4.58 |
| Facilitates discussion and encourages participation | 14 | 100% | 0% | 0% | 0% | 0% | 5.00 | 4.52 |
| Gives useful feedback on assignments | 14 | 86% | 0% | 14% | 0% | 0% | 4.71 | 4.45 |
| Returns assignments in a timely fashion | 13 | 92% | 8% | 0% | 0% | 0% | 4.92 | 4.43 |
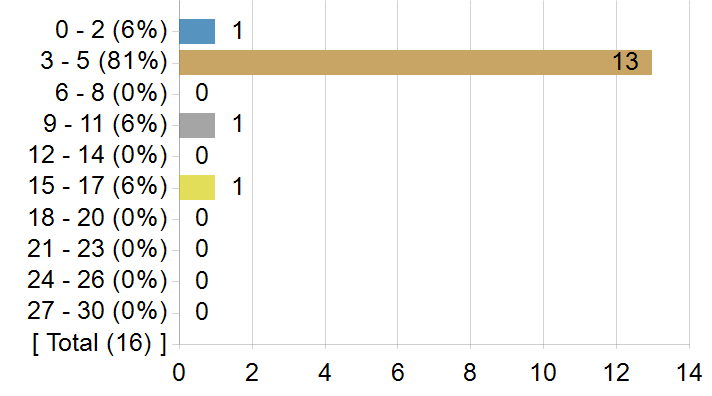
On average, how many hours per week did you spend on coursework outside of class? Enter a whole number between 0 and 168.
Frequency chart and mean excludes students who answered 31 or more hours.
On average, how many hours per week did you spend on coursework outside of class? Enter a whole number between 0 and 168.
| Statistics | Value |
|---|---|
| Response Count | 16 |
| Response Ratio | 67% |
| Mean | 4.69 |
| Median | 3.50 |
| Mode | 3 |
| Standard Deviation | 3.30 |
How strongly would you recommend this course to your peers?
How strongly would you recommend this course to your peers?

| Options | Score | Count | Percentage |
|---|---|---|---|
| Recommend with Enthusiasm | 5 | 12 | 75% |
| Likely to Recommend | 4 | 2 | 13% |
| Recommend with Reservations | 3 | 2 | 13% |
| Unlikely to Recommend | 2 | 0 | 0% |
| Definitely not Recommend | 1 | 0 | 0% |
| Statistics | Value |
|---|---|
| Response Ratio | 67% |
| Mean | 4.63 |
| Median | 5.00 |
| Standard Deviation | 0.72 |
What was/were your reason(s) for enrolling in this course? (Please check all that apply)
| Options | Count |
|---|---|
| Elective | 11 |
| Concentration or Department Requirement | 6 |
| Secondary Field or Language Citation Requirement | 0 |
| Undergraduate General Education Requirement | 0 |
| Expository Writing Requirement | 0 |
| Foreign Language Requirement | 0 |
| Pre-Med Requirement | 0 |
| Divisional Distribution Requirement | 0 |
| Quantitative Reasoning with Data Requirement | 0 |
Comments from students
What would you like to tell future students about this class? (Your response to this question may be published anonymously.)
| Comments |
|---|
| This course was the best I have taken at Harvard. Professor Lewis is one of the most caring, intelligent, and passionate professors you will EVER have. She knows the materiala and makes the space welcoming and encouraging to partake in. |
| Take this class!!! Professor Lewis is amazing and truly an incredible mentor and role model. The material is challenging but so interesting to dive into. |
| The night after our first class session for AAAS 112, I wrote in my journal that I think Professor Lewis is going to be one of the best professors I've ever had at this school. Her wisdom, and more importantly, the breathtaking vulnerability and sincerity she gifted us that day, made me profoundly admire her and want to be like her as a professor and as a human. Class after class, my admiration for her only continued to grow! She brilliantly designed this class to take us on a historical journey across the United States and its use of race for discrimination and oppression, empowering us to tackle hard discussions as a group while opening up space for everyone to feel comfortable sharing their experiences and ideas. Doing this through the lens of art, one of the strongest tools constructing the social narratives all around us that uphold such negative societal structures, was mind opening. I greatly looked forward to our discussions every Wednesday morning, where we would engage in deep close readings of paintings or photographs, discuss the conclusions and implications of our readings, and saw each other grow in the depth and quality of our work. I feel extremely fortunate to have had this experience with Professor Lewis! She is one of the most dedicated, passionate and kind professors I've had at this school! |
| Professor Lewis is a wonderful, well–rounded, and passion scholar and she truly cares about what she teaches. This course is an excellent opportunity to explore the intersection of racial equality and art history/aesthetics and it will be incredibly fulfilling, no matter your concentration. |
| professor lewis is an incredible teacher. very knowledgeable and encourages robust discussion in class. taking this class will definitely change your perspective on the connection between art and black representation. you also learn about amazing black artists and get to make your own exhibition |
| Such incredible content. Sarah Lewis is a PIONEER in her field and department, and it's truly such a cool experience. |
| Girl do the readings, but not alll of them. Do not leave the projects to the last minute cause your brain will blow–up and you will feel so drained. Everything is so much harder than you think.BE PROACTIVE! |
| Professor Lewis is great and passionate about what she does! I encourage every student to get to know her. In class, students are mainly leading discussions, and she truly loves to hear what each student has to say. As someone with no background in art, discussions can feel intimidating to engage in, but Prof. Lewis is truly on your side. It is a great class to learn more about art and its history in racial oppression and subjugation. It was a concept that I understood but never explicitly put into words until now. This class will greatly test your skills, and even if it feels difficult the work you put together at the end is very rewarding. Do not, and I repeat DO NOT, procrastinate the final assignment. It requires great work to put together an exhibit, and it is a very enjoyable process to find and sit with pieces that you are passionate about (especially not pressed under deadline). |
| This is a great course for an introduction to Black art. If you have any appreciation for art or social science, you will loveee this course. Professor Lewis is highly accomplished and has the experience and passion to make each topic come to life. |