Course Response Rate
| Raters | Students |
|---|---|
| Responded | 24 |
| Invited | 34 |
| Response Ratio | 71% |

Course General Questions
| Count | Excellent | Very Good | Good | Fair | Unsatisfactory | Course Mean | FAS Mean | |
|---|---|---|---|---|---|---|---|---|
| Evaluate the course overall. | 19 | 26% | 37% | 37% | 0% | 0% | 3.89 | 4.22 |
| Course materials (readings, audio-visual materials, textbooks, lab manuals, website, etc.) | 19 | 32% | 58% | 11% | 0% | 0% | 4.21 | 4.22 |
| Assignments (exams, essays, problem sets, language homework, etc.) | 19 | 21% | 47% | 32% | 0% | 0% | 3.89 | 4.10 |
| Feedback you received on work you produced in this course | 19 | 42% | 32% | 11% | 11% | 5% | 3.95 | 4.11 |
| Section component of the course | 19 | 68% | 26% | 5% | 0% | 0% | 4.63 | 4.25 |

General Instructor Questions
| Count | Excellent | Very Good | Good | Fair | Unsatisfactory | Instructor Mean | FAS Mean | |
|---|---|---|---|---|---|---|---|---|
| Evaluate your Instructor overall. | 16 | 63% | 31% | 0% | 6% | 0% | 4.50 | 4.53 |
| Gives effective lectures or presentations, if applicable | 15 | 67% | 13% | 13% | 7% | 0% | 4.40 | 4.43 |
| Is accessible outside of class (including after class, office hours, e-mail, etc.) | 15 | 20% | 7% | 40% | 27% | 7% | 3.07 | 4.50 |
| Generates enthusiasm for the subject matter | 16 | 88% | 6% | 6% | 0% | 0% | 4.81 | 4.60 |
| Facilitates discussion and encourages participation | 12 | 75% | 17% | 0% | 8% | 0% | 4.58 | 4.53 |
| Gives useful feedback on assignments | 4 | 75% | 0% | 25% | 0% | 0% | 4.50 | 4.48 |
| Returns assignments in a timely fashion | 4 | 100% | 0% | 0% | 0% | 0% | 5.00 | 4.46 |
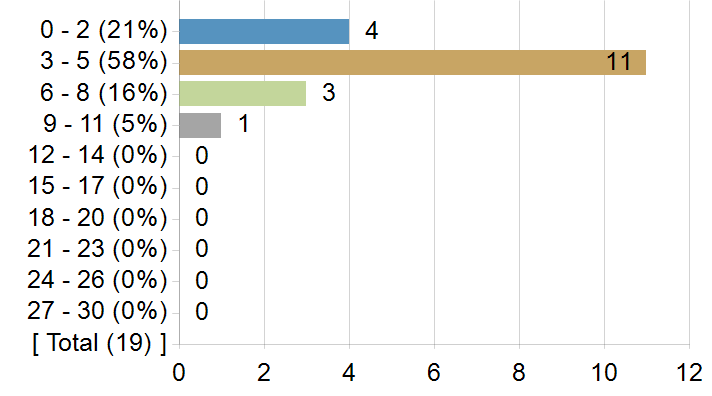
On average, how many hours per week did you spend on coursework outside of class? Enter a whole number between 0 and 168.
Frequency chart and mean excludes students who answered 31 or more hours.
On average, how many hours per week did you spend on coursework outside of class? Enter a whole number between 0 and 168.
| Statistics | Value |
|---|---|
| Response Count | 19 |
| Response Ratio | 56% |
| Mean | 4.11 |
| Median | 3.00 |
| Mode | 3 |
| Standard Deviation | 2.08 |
How strongly would you recommend this course to your peers?
How strongly would you recommend this course to your peers?

| Options | Score | Count | Percentage |
|---|---|---|---|
| Recommend with Enthusiasm | 5 | 8 | 44% |
| Likely to Recommend | 4 | 6 | 33% |
| Recommend with Reservations | 3 | 4 | 22% |
| Unlikely to Recommend | 2 | 0 | 0% |
| Definitely not Recommend | 1 | 0 | 0% |
| Statistics | Value |
|---|---|
| Response Ratio | 53% |
| Mean | 4.22 |
| Median | 4.00 |
| Standard Deviation | 0.81 |
What was/were your reason(s) for enrolling in this course? (Please check all that apply)
| Options | Count |
|---|---|
| Elective | 6 |
| Concentration or Department Requirement | 9 |
| Secondary Field or Language Citation Requirement | 3 |
| Undergraduate General Education Requirement | 0 |
| Expository Writing Requirement | 0 |
| Foreign Language Requirement | 0 |
| Pre-Med Requirement | 0 |
| Divisional Distribution Requirement | 1 |
| Quantitative Reasoning with Data Requirement | 0 |
Comments from students
What would you like to tell future students about this class? (Your response to this question may be published anonymously.)
| Comments |
|---|
| This course made me want to have a joint con concentration in African American studies. It's a great introduction to the department and opens the doors for many interests and possibilities. |
| Take this class!! I learned so much but also did not have to do too much work outside of class. |
| be prepared to read a lot |
| I really think students should be more willing to take classes that don't immediately seem applicable to them. As an Asian American, I took this course because I was curious about other POC experiences and the parallels in our histories/stories/oppression. It was really illuminating and I had realized how I had similarly compressed the African American community/identity as a monolith, similar to how many do for AAPI people. I enjoyed the class and with every class, you'll take away more the more you put into it. * |
| I would tell them not to take the class just for the professor, but also for the content. |
| Definitely take this course with celebrity professors Henry Louis Gates and Evelyn Higginbotham. Reading load is very manageable and interesting, and midterm is fine as long as you keep consistent with readings and take notes during lecture. |
| This is an amazing course especially for African American students. |
| This course is great if you want to learn a lot about African American history. Because this is an introductory course, there are a lot of names and dates thrown at you at once. If that is a style you enjoy, take this course. |
| Ok course. I wouldn't really call it a gem since there's two midterms. Kind of a lot for an intro class. |
| There are a lot of readings! They are not too difficult to get through though if you are passionate about this topic. The exams were somewhat difficult, but definitely manageable if you pay attention in lecture and go to section to review the material. |
| Please be mindful that you will not have access to lecture content outside of class so readings are a must. |