Course Response Rate
| Raters | Students |
|---|---|
| Responded | 58 |
| Invited | 73 |
| Response Ratio | 79% |

Course General Questions
| Count | Excellent | Very Good | Good | Fair | Unsatisfactory | Course Mean | FAS Mean | |
|---|---|---|---|---|---|---|---|---|
| Evaluate the course overall. | 44 | 59% | 27% | 14% | 0% | 0% | 4.45 | 4.22 |
| Course materials (readings, audio-visual materials, textbooks, lab manuals, website, etc.) | 45 | 36% | 44% | 18% | 2% | 0% | 4.13 | 4.22 |
| Assignments (exams, essays, problem sets, language homework, etc.) | 43 | 47% | 35% | 14% | 5% | 0% | 4.23 | 4.10 |
| Feedback you received on work you produced in this course | 43 | 47% | 21% | 23% | 9% | 0% | 4.05 | 4.11 |
| Section component of the course | 42 | 43% | 24% | 17% | 7% | 10% | 3.83 | 4.25 |

General Instructor Questions
| Count | Excellent | Very Good | Good | Fair | Unsatisfactory | Instructor Mean | FAS Mean | |
|---|---|---|---|---|---|---|---|---|
| Evaluate your Instructor overall. | 35 | 86% | 11% | 3% | 0% | 0% | 4.83 | 4.53 |
| Gives effective lectures or presentations, if applicable | 36 | 81% | 14% | 6% | 0% | 0% | 4.75 | 4.43 |
| Is accessible outside of class (including after class, office hours, e-mail, etc.) | 31 | 74% | 16% | 10% | 0% | 0% | 4.65 | 4.50 |
| Generates enthusiasm for the subject matter | 34 | 85% | 12% | 3% | 0% | 0% | 4.82 | 4.60 |
| Facilitates discussion and encourages participation | 29 | 76% | 21% | 3% | 0% | 0% | 4.72 | 4.53 |
| Gives useful feedback on assignments | 14 | 79% | 21% | 0% | 0% | 0% | 4.79 | 4.48 |
| Returns assignments in a timely fashion | 16 | 69% | 19% | 6% | 6% | 0% | 4.50 | 4.46 |
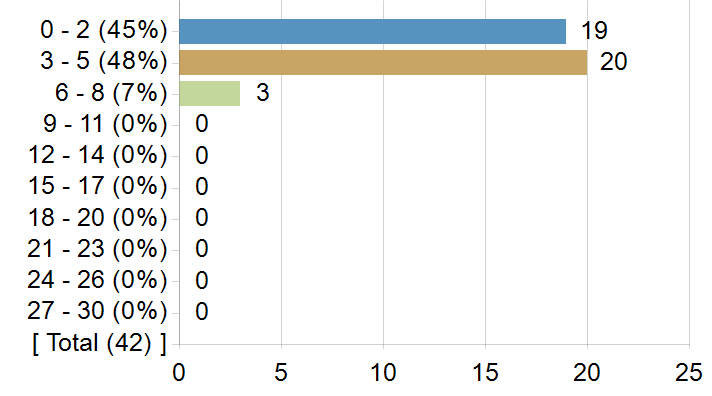
On average, how many hours per week did you spend on coursework outside of class? Enter a whole number between 0 and 168.
Frequency chart and mean excludes students who answered 31 or more hours.
On average, how many hours per week did you spend on coursework outside of class? Enter a whole number between 0 and 168.
| Statistics | Value |
|---|---|
| Response Count | 42 |
| Response Ratio | 58% |
| Mean | 2.98 |
| Median | 3.00 |
| Mode | 2 |
| Standard Deviation | 1.57 |
How strongly would you recommend this course to your peers?
How strongly would you recommend this course to your peers?

| Options | Score | Count | Percentage |
|---|---|---|---|
| Recommend with Enthusiasm | 5 | 32 | 73% |
| Likely to Recommend | 4 | 9 | 20% |
| Recommend with Reservations | 3 | 2 | 5% |
| Unlikely to Recommend | 2 | 1 | 2% |
| Definitely not Recommend | 1 | 0 | 0% |
| Statistics | Value |
|---|---|
| Response Ratio | 60% |
| Mean | 4.64 |
| Median | 5.00 |
| Standard Deviation | 0.69 |
What was/were your reason(s) for enrolling in this course? (Please check all that apply)
| Options | Count |
|---|---|
| Elective | 32 |
| Concentration or Department Requirement | 5 |
| Secondary Field or Language Citation Requirement | 1 |
| Undergraduate General Education Requirement | 1 |
| Expository Writing Requirement | 0 |
| Foreign Language Requirement | 0 |
| Pre-Med Requirement | 0 |
| Divisional Distribution Requirement | 4 |
| Quantitative Reasoning with Data Requirement | 0 |
Comments from students
What would you like to tell future students about this class? (Your response to this question may be published anonymously.)
| Comments |
|---|
| Take this course if you’re interested in learning more about chocolates! The tastings are fun, although the readings can be a bit long so time manage well. |
| This is a great elective course. The content is really interesting and will change the way you view chocolate. |
| Take this class! |
| N/A |
| great class, would recommend, there are chocolate tastings, which are yummy |
| This class can get boring, but it is very easy. |
| Wonderful class! Couldn't recommend more highly. |
| Such an interesting and fun course! Dr. Martin and the teaching staff are all amazing and so incredibly kind. The lectures, diverse reading material, and chocolate tastings make it such a unique class you won't find anywhere else. |
| The chocolate tastings were a highlight and it was definitely worth the readings. |
| This class is a good introduction into critical race and food studies. The teaching staff were generally really helpful and Professor Martin's lecture content was interesting. At times the class felt like it lacked overarching critical food studies frameworks that would be better ground the class's focus on chocolate within questions of power, race, gender, and class. |
| Definitely would recommend this class. |
| Class workload is super manageable and assignments throughout the semester are beyond reasonable. And you get to have really good chocolate in class! I would highly recommend |
| If you have ANY space for classes at Harvard, make sure to take this class. Carla Martin is an angel and one of the best lecturers I've ever experienced. The content of this course is SO interesting and really makes you rethink history and appreciate a very new lens (food) through which to view historical development. You learn about such a diversity of topics from the literal production process of cacao to the Pre–Columbian historical roots to the history in Mesoamerica to slavery and advertisements. It's a really well–thought–out class and a genuinely fantastic time. Also, the chocolate tastings >>>>> wow! |
| gem! get to taste chocolate and material is interesting. class is recorded and assignments are all online! |
| Such an interesting and fun class |
| This is a great course. If you stay on top of the readings and attend lecture you will learn a lot, and get to try some chocolate too! |
| This class is engaging, exciting, and unique. I really loved it. |
| This is an excellent course! Dr. Martin is a fantastic lecturer, the material of the course is so interesting, the section was fun, and we got to eat chocolate in class! The assignments of the course were really manageable. The only thing I disliked is that there was a final essay and a final timeline project at the end of the semester. Would have liked to see the timeline project earlier in the course! |
| This class does a wonderful job of contextualizing world history and the way in which supply and demand have shaped the chocolate market, the environment, and the lives of consumers and producers alike. |
| TAKE THIS CLASS. The professor is so sweet and the TFs are amazing. Also there are a lot of tastings in this class so if you like chocolate that's a great bonus. Even though there are two quizzes, there are both take home and doable if you pay attention in section. You don't have to do all the readings to do well, but make sure to participate in section as much as you can. Honestly this is one of those courses where the TF you get determines whether it's a "gem" or not. But overall, great class, nice teaching staff and interesting topic. TAKE IT. |
| I love it! Definitely take it. Great course staff. |