Course Response Rate
| Raters | Students |
|---|---|
| Responded | 25 |
| Invited | 35 |
| Response Ratio | 71% |

Course General Questions
| Count | Excellent | Very Good | Good | Fair | Unsatisfactory | Course Mean | FAS Mean | |
|---|---|---|---|---|---|---|---|---|
| Evaluate the course overall. | 21 | 81% | 10% | 10% | 0% | 0% | 4.71 | 4.26 |
| Course materials (readings, audio-visual materials, textbooks, lab manuals, website, etc.) | 21 | 57% | 33% | 10% | 0% | 0% | 4.48 | 4.24 |
| Assignments (exams, essays, problem sets, language homework, etc.) | 21 | 71% | 19% | 10% | 0% | 0% | 4.62 | 4.14 |
| Feedback you received on work you produced in this course | 21 | 52% | 33% | 10% | 5% | 0% | 4.33 | 4.14 |
| Section component of the course | 21 | 67% | 14% | 10% | 5% | 5% | 4.33 | 4.29 |

General Instructor Questions
| Count | Excellent | Very Good | Good | Fair | Unsatisfactory | Instructor Mean | FAS Mean | |
|---|---|---|---|---|---|---|---|---|
| Evaluate your Instructor overall. | 17 | 88% | 12% | 0% | 0% | 0% | 4.88 | 4.54 |
| Gives effective lectures or presentations, if applicable | 17 | 82% | 6% | 6% | 6% | 0% | 4.65 | 4.46 |
| Is accessible outside of class (including after class, office hours, e-mail, etc.) | 16 | 75% | 13% | 13% | 0% | 0% | 4.63 | 4.52 |
| Generates enthusiasm for the subject matter | 17 | 88% | 12% | 0% | 0% | 0% | 4.88 | 4.61 |
| Facilitates discussion and encourages participation | 16 | 75% | 19% | 0% | 0% | 6% | 4.56 | 4.59 |
| Gives useful feedback on assignments | 4 | 75% | 25% | 0% | 0% | 0% | 4.75 | 4.52 |
| Returns assignments in a timely fashion | 5 | 60% | 20% | 20% | 0% | 0% | 4.40 | 4.49 |
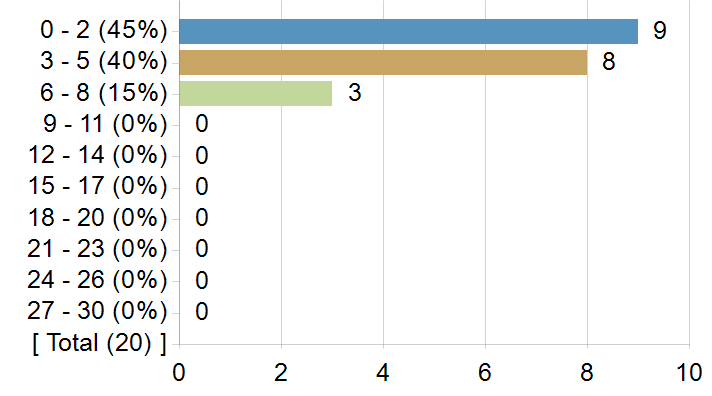
On average, how many hours per week did you spend on coursework outside of class? Enter a whole number between 0 and 168.
Frequency chart and mean excludes students who answered 31 or more hours.
On average, how many hours per week did you spend on coursework outside of class? Enter a whole number between 0 and 168.
| Statistics | Value |
|---|---|
| Response Count | 20 |
| Response Ratio | 57% |
| Mean | 3.25 |
| Median | 3.00 |
| Mode | 2 |
| Standard Deviation | 2.02 |
How strongly would you recommend this course to your peers?
How strongly would you recommend this course to your peers?

| Options | Score | Count | Percentage |
|---|---|---|---|
| Recommend with Enthusiasm | 5 | 17 | 81% |
| Likely to Recommend | 4 | 2 | 10% |
| Recommend with Reservations | 3 | 2 | 10% |
| Unlikely to Recommend | 2 | 0 | 0% |
| Definitely not Recommend | 1 | 0 | 0% |
| Statistics | Value |
|---|---|
| Response Ratio | 60% |
| Mean | 4.71 |
| Median | 5.00 |
| Standard Deviation | 0.64 |
What was/were your reason(s) for enrolling in this course? (Please check all that apply)
| Options | Count |
|---|---|
| Elective | 11 |
| Concentration or Department Requirement | 4 |
| Secondary Field or Language Citation Requirement | 2 |
| Undergraduate General Education Requirement | 0 |
| Expository Writing Requirement | 0 |
| Foreign Language Requirement | 0 |
| Pre-Med Requirement | 0 |
| Divisional Distribution Requirement | 7 |
| Quantitative Reasoning with Data Requirement | 0 |
In this course, most students listen attentively with an open mind and a willingness to change their point of view as they learn more about the topic.
In this course, most students listen attentively with an open mind and a willingness to change their point of view as they learn more about the topic.

| Options | Score | Count | Percentage |
|---|---|---|---|
| Strongly Agree | 5 | 15 | 71% |
| Agree | 4 | 5 | 24% |
| Neither Agree nor Disagree | 3 | 1 | 5% |
| Disagree | 2 | 0 | 0% |
| Strongly Disagree | 1 | 0 | 0% |
| Statistics | Value |
|---|---|
| Response Ratio | 60% |
| Mean | 4.67 |
| Median | 5.00 |
| Standard Deviation | 0.58 |
In this course (including sections), I feel comfortable expressing my views on controversial topics.
In this course (including sections), I feel comfortable expressing my views on controversial topics.

| Options | Score | Count | Percentage |
|---|---|---|---|
| Strongly Agree | 5 | 16 | 76% |
| Agree | 4 | 4 | 19% |
| Neither Agree nor Disagree | 3 | 1 | 5% |
| Disagree | 2 | 0 | 0% |
| Strongly Disagree | 1 | 0 | 0% |
| Statistics | Value |
|---|---|
| Response Ratio | 60% |
| Mean | 4.71 |
| Median | 5.00 |
| Standard Deviation | 0.56 |
Comments from students
What would you like to tell future students about this class? (Your response to this question may be published anonymously.)
| Comments |
|---|
| gem |
| Great course 10/10, Super engaging material––the subject seems very niche, but this is a rlly interdisciplinary course combining ethics, politics, economics, and history in an engaging way |
| TAKE IT!! You learn so much about global chocolate production and the cocoa industry. The topics in this course also takes from every different concentration that there is something for everyone to apply to their academic journey. The course staff are also super encouraging throughout the semester! |
| Take this class for an interesting and relatively smooth class. |
| This class was great––interesting material taught by an incredible, passionate lecturer in Carla Martin, along with chocolate tastings! |
| This is an excellent and engaging class that I found a joy to attend, and I hope more students are able to recognize the history, experiences, and roles of chocolate in their lives so that they can come with questions that this class will surely clarify. |
| This is a great class for senior spring – you'll learn a lot without having to put in a ton of work outside of class, and the assignments are not difficult. Professor Martin's lectures are also amazing, and the tastings are always a plus! |
| This is a PHENOMENAL class and I would highly recommend taking it. Carla is probably the best lecturer I've had at Harvard and she makes every lecture so captivating and entertaining. Sections are also super fun and we get to engage more critically with the readings and participate in meaningful discussions. Of course, getting to taste chocolate most weeks is also a huge plus (especially when they are so delicious)! The exams are very reasonable and the teaching staff goes out of their way to make sure that we are prepared. The projects were also super interesting and allowed us to delve into a topic of our choice. Overall, the class is so well executed and I was so impressed with the team. TAKE IT!! |
| TAKE THE CLASS |
| TAKE THIS CLASS!! Truly a gem, but genuinely an interesting and worthwhile course. I had never taken a class related to chocolate before, or even thought to much about chocolate and its history (like most people), but this course changed the way I'll go about consuming chocolate. Definitely engage with the course readings if you can! Professor Martin is so amazing and knowledgeable. One regret I do have is not attending her office hours. This course is a great fifth class, and you'll love the lectures (most days)! We also get to try chocolates in class some days! |
| Such a good class! An interesting topic that’s lets you explore from any angle—humanities, culture, economic, etc. |