Course Response Rate
| Raters | Students |
|---|---|
| Responded | 6 |
| Invited | 6 |
| Response Ratio | 100% |

Course General Questions
| Count | Excellent | Very Good | Good | Fair | Unsatisfactory | Course Mean | FAS Mean | |
|---|---|---|---|---|---|---|---|---|
| Evaluate the course overall. | 6 | 83% | 17% | 0% | 0% | 0% | 4.83 | 4.23 |
| Course materials (readings, audio-visual materials, textbooks, lab manuals, website, etc.) | 6 | 67% | 33% | 0% | 0% | 0% | 4.67 | 4.24 |
| Assignments (exams, essays, problem sets, language homework, etc.) | 6 | 50% | 33% | 17% | 0% | 0% | 4.33 | 4.09 |
| Feedback you received on work you produced in this course | 6 | 50% | 17% | 33% | 0% | 0% | 4.17 | 4.13 |
| Section component of the course | 1 | 100% | 0% | 0% | 0% | 0% | 5.00 | 4.24 |

General Instructor Questions
| Count | Excellent | Very Good | Good | Fair | Unsatisfactory | Instructor Mean | FAS Mean | |
|---|---|---|---|---|---|---|---|---|
| Evaluate your Instructor overall. | 6 | 100% | 0% | 0% | 0% | 0% | 5.00 | 4.55 |
| Gives effective lectures or presentations, if applicable | 5 | 80% | 20% | 0% | 0% | 0% | 4.80 | 4.44 |
| Is accessible outside of class (including after class, office hours, e-mail, etc.) | 6 | 83% | 17% | 0% | 0% | 0% | 4.83 | 4.52 |
| Generates enthusiasm for the subject matter | 6 | 100% | 0% | 0% | 0% | 0% | 5.00 | 4.58 |
| Facilitates discussion and encourages participation | 6 | 83% | 17% | 0% | 0% | 0% | 4.83 | 4.50 |
| Gives useful feedback on assignments | 6 | 50% | 33% | 17% | 0% | 0% | 4.33 | 4.51 |
| Returns assignments in a timely fashion | 6 | 100% | 0% | 0% | 0% | 0% | 5.00 | 4.46 |
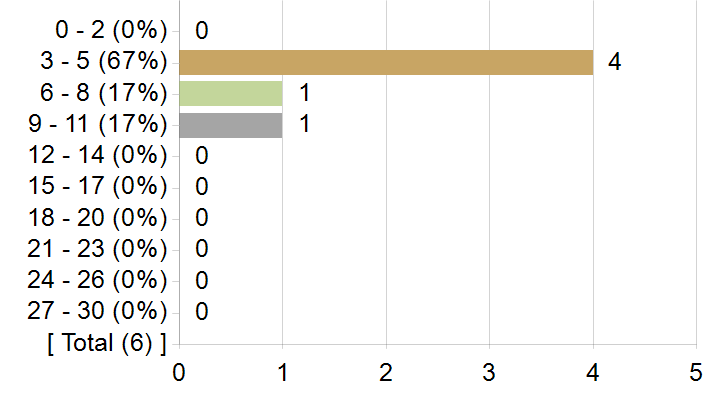
On average, how many hours per week did you spend on coursework outside of class? Enter a whole number between 0 and 168.
Frequency chart and mean excludes students who answered 31 or more hours.
On average, how many hours per week did you spend on coursework outside of class? Enter a whole number between 0 and 168.
| Statistics | Value |
|---|---|
| Response Count | 6 |
| Response Ratio | 100% |
| Mean | 5.17 |
| Median | 4.00 |
| Mode | 4 |
| Standard Deviation | 2.56 |
How strongly would you recommend this course to your peers?
How strongly would you recommend this course to your peers?

| Options | Score | Count | Percentage |
|---|---|---|---|
| Recommend with Enthusiasm | 5 | 5 | 83% |
| Likely to Recommend | 4 | 1 | 17% |
| Recommend with Reservations | 3 | 0 | 0% |
| Unlikely to Recommend | 2 | 0 | 0% |
| Definitely not Recommend | 1 | 0 | 0% |
| Statistics | Value |
|---|---|
| Response Ratio | 100% |
| Mean | 4.83 |
| Median | 5.00 |
| Standard Deviation | 0.41 |
What was/were your reason(s) for enrolling in this course? (Please check all that apply)
| Options | Count |
|---|---|
| Elective | 4 |
| Concentration or Department Requirement | 0 |
| Secondary Field or Language Citation Requirement | 3 |
| Undergraduate General Education Requirement | 0 |
| Expository Writing Requirement | 0 |
| Foreign Language Requirement | 0 |
| Pre-Med Requirement | 0 |
| Divisional Distribution Requirement | 0 |
| Quantitative Reasoning with Data Requirement | 0 |
Comments from students
What would you like to tell future students about this class?
| Comments |
|---|
| That it is broad and all–encompassing, and there is a niche to be found for everyone within its material. |
| Please take this class! Professor Agbiboa is stellar! I followed him from Introduction to African Studies to this class that he teaches now and I don't regret it one bit. I find that, because he is so receptive and creates a welcoming environment for people to ask questions and contemplate their own revelations, I have grown so much and been forced to confront different aspects of myself as a result. He also rewards students grade–wise for thinking out of the box and pursuing their interests through the course. |
| Take this class if you are at all interested in mobility, transit, socio–spatial theory, urban politics... just take it! The readings are fascinating and Professor Agbiboa carefully selects them to generate discussion. This is also really one of the only undergrad classes available that engages with geography as a discipline. Be warned that there are a fair number of assignments and group work– 3 papers and frequent presentations. |
| This class was an amazing learning experience with manageable work and I absolutely recommend! |