Course Response Rate
| Raters | Students |
|---|---|
| Responded | 15 |
| Invited | 16 |
| Response Ratio | 94% |

Course General Questions
| Count | Excellent | Very Good | Good | Fair | Unsatisfactory | Course Mean | FAS Mean | |
|---|---|---|---|---|---|---|---|---|
| Evaluate the course overall. | 15 | 67% | 33% | 0% | 0% | 0% | 4.67 | 4.25 |
| Course materials (readings, audio-visual materials, textbooks, lab manuals, website, etc.) | 15 | 60% | 27% | 13% | 0% | 0% | 4.47 | 4.25 |
| Assignments (exams, essays, problem sets, language homework, etc.) | 12 | 67% | 17% | 17% | 0% | 0% | 4.50 | 4.12 |
| Feedback you received on work you produced in this course | 14 | 64% | 14% | 7% | 7% | 7% | 4.21 | 4.13 |
| Section component of the course | 3 | 100% | 0% | 0% | 0% | 0% | 5.00 | 4.27 |

General Instructor Questions
| Count | Excellent | Very Good | Good | Fair | Unsatisfactory | Instructor Mean | FAS Mean | |
|---|---|---|---|---|---|---|---|---|
| Evaluate your Instructor overall. | 13 | 85% | 15% | 0% | 0% | 0% | 4.85 | 4.55 |
| Gives effective lectures or presentations, if applicable | 13 | 69% | 23% | 8% | 0% | 0% | 4.62 | 4.46 |
| Is accessible outside of class (including after class, office hours, e-mail, etc.) | 12 | 83% | 8% | 8% | 0% | 0% | 4.75 | 4.51 |
| Generates enthusiasm for the subject matter | 13 | 77% | 23% | 0% | 0% | 0% | 4.77 | 4.62 |
| Facilitates discussion and encourages participation | 13 | 85% | 0% | 15% | 0% | 0% | 4.69 | 4.58 |
| Gives useful feedback on assignments | 11 | 73% | 18% | 9% | 0% | 0% | 4.64 | 4.52 |
| Returns assignments in a timely fashion | 10 | 60% | 20% | 20% | 0% | 0% | 4.40 | 4.48 |
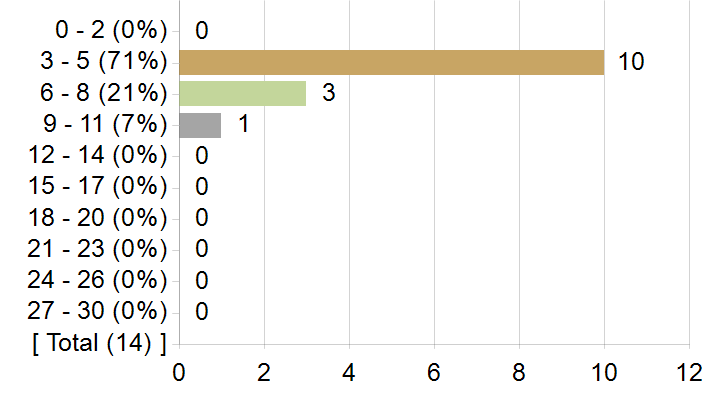
On average, how many hours per week did you spend on coursework outside of class? Enter a whole number between 0 and 168.
Frequency chart and mean excludes students who answered 31 or more hours.
On average, how many hours per week did you spend on coursework outside of class? Enter a whole number between 0 and 168.
| Statistics | Value |
|---|---|
| Response Count | 14 |
| Response Ratio | 88% |
| Mean | 5.21 |
| Median | 5.00 |
| Mode | 5 |
| Standard Deviation | 1.85 |
How strongly would you recommend this course to your peers?
How strongly would you recommend this course to your peers?

| Options | Score | Count | Percentage |
|---|---|---|---|
| Recommend with Enthusiasm | 5 | 9 | 60% |
| Likely to Recommend | 4 | 6 | 40% |
| Recommend with Reservations | 3 | 0 | 0% |
| Unlikely to Recommend | 2 | 0 | 0% |
| Definitely not Recommend | 1 | 0 | 0% |
| Statistics | Value |
|---|---|
| Response Ratio | 94% |
| Mean | 4.60 |
| Median | 5.00 |
| Standard Deviation | 0.51 |
What was/were your reason(s) for enrolling in this course? (Please check all that apply)
| Options | Count |
|---|---|
| Elective | 10 |
| Concentration or Department Requirement | 4 |
| Secondary Field or Language Citation Requirement | 0 |
| Undergraduate General Education Requirement | 0 |
| Expository Writing Requirement | 0 |
| Foreign Language Requirement | 0 |
| Pre-Med Requirement | 0 |
| Divisional Distribution Requirement | 1 |
| Quantitative Reasoning with Data Requirement | 0 |
In this course, most students listen attentively with an open mind and a willingness to change their point of view as they learn more about the topic.
In this course, most students listen attentively with an open mind and a willingness to change their point of view as they learn more about the topic.

| Options | Score | Count | Percentage |
|---|---|---|---|
| Strongly Agree | 5 | 12 | 80% |
| Agree | 4 | 3 | 20% |
| Neither Agree nor Disagree | 3 | 0 | 0% |
| Disagree | 2 | 0 | 0% |
| Strongly Disagree | 1 | 0 | 0% |
| Statistics | Value |
|---|---|
| Response Ratio | 94% |
| Mean | 4.80 |
| Median | 5.00 |
| Standard Deviation | 0.41 |
In this course (including sections), I feel comfortable expressing my views on controversial topics.
In this course (including sections), I feel comfortable expressing my views on controversial topics.

| Options | Score | Count | Percentage |
|---|---|---|---|
| Strongly Agree | 5 | 13 | 93% |
| Agree | 4 | 0 | 0% |
| Neither Agree nor Disagree | 3 | 1 | 7% |
| Disagree | 2 | 0 | 0% |
| Strongly Disagree | 1 | 0 | 0% |
| Statistics | Value |
|---|---|
| Response Ratio | 88% |
| Mean | 4.86 |
| Median | 5.00 |
| Standard Deviation | 0.53 |
Comments from students
What would you like to tell future students about this class? (Your response to this question may be published anonymously.)
| Comments |
|---|
| definitely take this course if you are interested in civil rights or legal history. prof Higginbotham is brilliant and so so kind and helpful. |
| I enjoyed learning from Professor Higginbotham! She is very knowledgable about African American history and also offered great insights. I just think more set one–on–one time and feedback would have been helpful. I also wish that we could have gotten the required readings for free as we only used them for one class session. Overall though I enjoyed the course! |
| It’s a low stress environment where you can learn a lot from your classmates |
| TAKE THIS COURSE! |
| Heavy readings, but so incredibly worth it! They are all fascinating and spark engaging discussions. |
| I would tell students that they should take it if they are curious, but I cannot recommend it with absolute enthusiasm regarding how it operated as a seminar. Professor Higginbotham and Jelani were very nice and great resources, however. |
| Be prepared to digest heavy loads of reading (often a book a week) but also be consistently preparing for the final paper. You will also be asked to participate regularly during seminars, which students have varying levels of comfort with. That said, Professor Higginbotham makes herself tremendously available and so does Jelani. You will learn a great deal from their paired experience and thoughtful feedback! |
| Interesting content, but reading's were too dense. |
| I would recommend the course! It is topical and timely. Learning the material presented in this class will make you a more informed civic participant. |