Course Response Rate
| Raters | Students |
|---|---|
| Responded | 22 |
| Invited | 32 |
| Response Ratio | 69% |

Course General Questions
| Count | Excellent | Very Good | Good | Fair | Unsatisfactory | Course Mean | FAS Mean | |
|---|---|---|---|---|---|---|---|---|
| Evaluate the course overall. | 18 | 72% | 22% | 6% | 0% | 0% | 4.67 | 4.22 |
| Course materials (readings, audio-visual materials, textbooks, lab manuals, website, etc.) | 18 | 89% | 11% | 0% | 0% | 0% | 4.89 | 4.22 |
| Assignments (exams, essays, problem sets, language homework, etc.) | 18 | 56% | 33% | 11% | 0% | 0% | 4.44 | 4.10 |
| Feedback you received on work you produced in this course | 18 | 67% | 17% | 6% | 11% | 0% | 4.39 | 4.11 |
| Section component of the course | 3 | 100% | 0% | 0% | 0% | 0% | 5.00 | 4.25 |

General Instructor Questions
| Count | Excellent | Very Good | Good | Fair | Unsatisfactory | Instructor Mean | FAS Mean | |
|---|---|---|---|---|---|---|---|---|
| Evaluate your Instructor overall. | 17 | 76% | 24% | 0% | 0% | 0% | 4.76 | 4.53 |
| Gives effective lectures or presentations, if applicable | 17 | 76% | 18% | 6% | 0% | 0% | 4.71 | 4.43 |
| Is accessible outside of class (including after class, office hours, e-mail, etc.) | 17 | 82% | 12% | 6% | 0% | 0% | 4.76 | 4.50 |
| Generates enthusiasm for the subject matter | 17 | 100% | 0% | 0% | 0% | 0% | 5.00 | 4.60 |
| Facilitates discussion and encourages participation | 16 | 75% | 19% | 6% | 0% | 0% | 4.69 | 4.53 |
| Gives useful feedback on assignments | 12 | 83% | 8% | 8% | 0% | 0% | 4.75 | 4.48 |
| Returns assignments in a timely fashion | 12 | 83% | 17% | 0% | 0% | 0% | 4.83 | 4.46 |
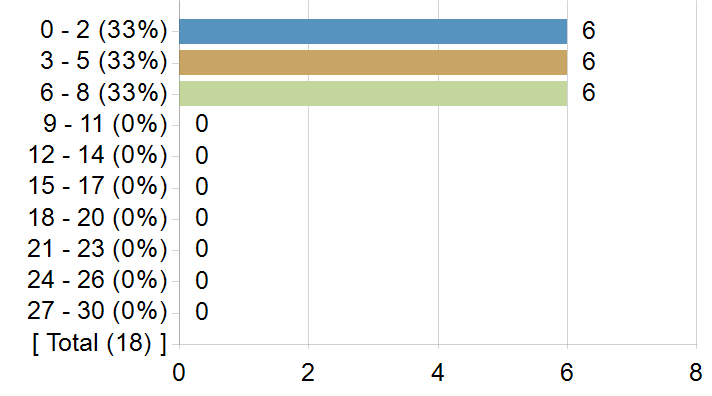
On average, how many hours per week did you spend on coursework outside of class? Enter a whole number between 0 and 168.
Frequency chart and mean excludes students who answered 31 or more hours.
On average, how many hours per week did you spend on coursework outside of class? Enter a whole number between 0 and 168.
| Statistics | Value |
|---|---|
| Response Count | 18 |
| Response Ratio | 56% |
| Mean | 4.17 |
| Median | 4.00 |
| Mode | 2 |
| Standard Deviation | 2.07 |
How strongly would you recommend this course to your peers?
How strongly would you recommend this course to your peers?

| Options | Score | Count | Percentage |
|---|---|---|---|
| Recommend with Enthusiasm | 5 | 12 | 71% |
| Likely to Recommend | 4 | 4 | 24% |
| Recommend with Reservations | 3 | 1 | 6% |
| Unlikely to Recommend | 2 | 0 | 0% |
| Definitely not Recommend | 1 | 0 | 0% |
| Statistics | Value |
|---|---|
| Response Ratio | 53% |
| Mean | 4.65 |
| Median | 5.00 |
| Standard Deviation | 0.61 |
What was/were your reason(s) for enrolling in this course? (Please check all that apply)
| Options | Count |
|---|---|
| Elective | 13 |
| Concentration or Department Requirement | 3 |
| Secondary Field or Language Citation Requirement | 1 |
| Undergraduate General Education Requirement | 0 |
| Expository Writing Requirement | 0 |
| Foreign Language Requirement | 0 |
| Pre-Med Requirement | 0 |
| Divisional Distribution Requirement | 2 |
| Quantitative Reasoning with Data Requirement | 0 |
Comments from students
What would you like to tell future students about this class? (Your response to this question may be published anonymously.)
| Comments |
|---|
| If you're thinking about taking this course? Take it. Studying AFRAMER? take it. Are Black? Take it. Don't know anything about humor? Take it. Literally a senior in our last semester? take it. |
| Great content in this class; I've been exposed to several great novels, routines, and just cultural references in general! Little heavy on the reading but not bad, and great environment between peers and professor. |
| This course has great materials but you get out of it what you put in––I found the class discussions to be very superficial while I the content and potential of the material was incredible which can be a bit frustrating if you're looking for deep connections between humor and society |
| Be ready to LAUGH! |
| Take this class! Professor Carpio is a one–of–a–kind lecturer and the longer readings are definitely worth it! |
| Professor Carpio is an incredible lecturer and really cares. Such a fire class and the material is so fun. Definitely take. |
| Take this class if you want to be laughing or completely shocked by the end of class. this course covers so many hilariously painful topics and Professor Carpio really pushes you to think about Humor and how its functions in black society. the course material is great, you will be learning form a plethora of different media and although there is a little but of writting its definitely worth it because this class is like no other i've ever taken |
| take this if you're willing to put in the work. there's an absurd amount of reading every week, so you need to have a sense of what to prioritize. if you come to class excited to discuss the materials it will be worth your while. |
| TAKE IT!! Prof Carpio is wonderful and the class is so fun/funny. |
| This course is a must. The class was mostly Black students and people of color, which made it a very welcoming and good space to learn about the foundations of African American humor. |