Course Response Rate
| Raters | Students |
|---|---|
| Responded | 22 |
| Invited | 22 |
| Response Ratio | 100% |

Course General Questions
| Count | Excellent | Very Good | Good | Fair | Unsatisfactory | Course Mean | FAS Mean | |
|---|---|---|---|---|---|---|---|---|
| Evaluate the course overall. | 21 | 33% | 43% | 24% | 0% | 0% | 4.10 | 4.21 |
| Course materials (readings, audio-visual materials, textbooks, lab manuals, website, etc.) | 20 | 35% | 40% | 25% | 0% | 0% | 4.10 | 4.20 |
| Assignments (exams, essays, problem sets, language homework, etc.) | 20 | 45% | 30% | 20% | 5% | 0% | 4.15 | 4.07 |
| Feedback you received on work you produced in this course | 20 | 45% | 25% | 25% | 5% | 0% | 4.10 | 4.08 |
| Section component of the course | 18 | 44% | 39% | 11% | 6% | 0% | 4.22 | 4.22 |

General Instructor Questions
| Count | Excellent | Very Good | Good | Fair | Unsatisfactory | Instructor Mean | FAS Mean | |
|---|---|---|---|---|---|---|---|---|
| Evaluate your Instructor overall. | 18 | 61% | 33% | 0% | 6% | 0% | 4.50 | 4.51 |
| Gives effective lectures or presentations, if applicable | 19 | 53% | 37% | 5% | 5% | 0% | 4.37 | 4.39 |
| Is accessible outside of class (including after class, office hours, e-mail, etc.) | 17 | 47% | 24% | 18% | 12% | 0% | 4.06 | 4.44 |
| Generates enthusiasm for the subject matter | 19 | 68% | 16% | 11% | 0% | 5% | 4.42 | 4.58 |
| Facilitates discussion and encourages participation | 19 | 74% | 16% | 5% | 5% | 0% | 4.58 | 4.52 |
| Gives useful feedback on assignments | 19 | 63% | 26% | 5% | 5% | 0% | 4.47 | 4.45 |
| Returns assignments in a timely fashion | 19 | 47% | 26% | 21% | 5% | 0% | 4.16 | 4.43 |
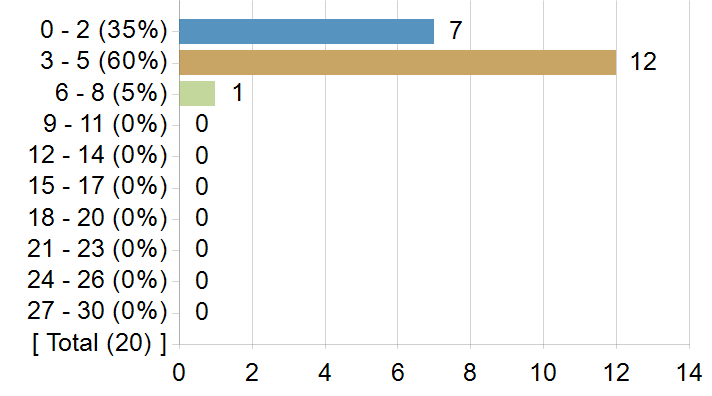
On average, how many hours per week did you spend on coursework outside of class? Enter a whole number between 0 and 168.
Frequency chart and mean excludes students who answered 31 or more hours.
On average, how many hours per week did you spend on coursework outside of class? Enter a whole number between 0 and 168.
| Statistics | Value |
|---|---|
| Response Count | 20 |
| Response Ratio | 91% |
| Mean | 3.05 |
| Median | 3.00 |
| Mode | 3 |
| Standard Deviation | 1.64 |
How strongly would you recommend this course to your peers?
How strongly would you recommend this course to your peers?

| Options | Score | Count | Percentage |
|---|---|---|---|
| Recommend with Enthusiasm | 5 | 7 | 35% |
| Likely to Recommend | 4 | 11 | 55% |
| Recommend with Reservations | 3 | 1 | 5% |
| Unlikely to Recommend | 2 | 1 | 5% |
| Definitely not Recommend | 1 | 0 | 0% |
| Statistics | Value |
|---|---|
| Response Ratio | 91% |
| Mean | 4.20 |
| Median | 4.00 |
| Standard Deviation | 0.77 |
What was/were your reason(s) for enrolling in this course? (Please check all that apply)
| Options | Count |
|---|---|
| Elective | 8 |
| Concentration or Department Requirement | 5 |
| Secondary Field or Language Citation Requirement | 5 |
| Undergraduate General Education Requirement | 0 |
| Expository Writing Requirement | 0 |
| Foreign Language Requirement | 0 |
| Pre-Med Requirement | 0 |
| Divisional Distribution Requirement | 2 |
| Quantitative Reasoning with Data Requirement | 0 |
Comments from students
What would you like to tell future students about this class? (Your response to this question may be published anonymously.)
| Comments |
|---|
| Take this class If you want to learn more about Africa! It is well structured and you don't need to know much about Africa in order to take this class. |
| TAKE IT!!! This class is an absolute gem! The workload is not bad at all. The professor and TF were so kind and passionate about the topic, which makes the class even more enjoyable. I've never read this many African writers, and I genuinely enjoyed it! |
| Highly recommend this class! It gives you a great insight into the imaging of Africa and gets you to challenge all of the preconceived notions of the continent, whether through personal experience or societal attitudes. Professor Agbiboa is passionate about the thinking of Africa |
| This class is a great introduction to African studies and the AAAS department as a whole. |
| Take it and don't hesitate. Lean in to listen and question everything, and enjoy the fact that it's a class that, even though often focused on theory and historical/sociopolitical analysis, is at its core about living breathing people. |
| I enjoyed this class! I think if you stay on top of some of the readings and really reflect on the questions/discussions, it can be a transformative experience for you. |
| Take this course if you are looking for a course that is more solution forward. This course is not about spitting facts out at you about African countries. It is about being critical of everything that we have learned about Africa, how we can be intentional when studying Africa, and encouraging nuanced conservation. |
| Take this course if you like more discussion–based courses, you decide how much you get out of the course by how well you do the readings. It's a pretty chill class and the professor is really good and interesting. You learn more about the generalizations of Africa and the stereotypes made about it rather than the intro but you can still come out of the class learning a lot. Work is not too bad either and very manageable. |
| TAKE THIS CLASS. Especially if you are interested in Africa. Very engaging conversations, good structure, and almost nonexistent workload except for the 2 essays book review, and weekly discussion posts. This is a very useful class if you wanna learn more about the best continent; Africa. |
| this is a very good class but your enjoyment/how much you get from it will largely depend on your classmates and what they contribute to discussion and your ability to be present and engage with the course material. |
| Going to class would be very helpful in understanding the course material more. |
| There's not a lot of lecturing. Just students ranting and babbling for two hours. Not fun to listen to at 9am. A lot of the course is completing readings and teaching yourself. But Professor Agbiboa is very knowledgable and a great contact/resource to have if you're interested in research in/related to Africa. |