Course Response Rate
| Raters | Students |
|---|---|
| Responded | 5 |
| Invited | 6 |
| Response Ratio | 83% |

Course General Questions
| Count | Excellent | Very Good | Good | Fair | Unsatisfactory | Course Mean | FAS Mean | |
|---|---|---|---|---|---|---|---|---|
| Evaluate the course overall. | 5 | 40% | 0% | 40% | 20% | 0% | 3.60 | 4.18 |
| Course materials (readings, audio-visual materials, textbooks, lab manuals, website, etc.) | 4 | 50% | 25% | 25% | 0% | 0% | 4.25 | 4.19 |
| Assignments (exams, essays, problem sets, language homework, etc.) | 4 | 50% | 0% | 25% | 25% | 0% | 3.75 | 4.05 |
| Feedback you received on work you produced in this course | 3 | 33% | 0% | 33% | 33% | 0% | 3.33 | 4.08 |
| Section component of the course | 1 | 100% | 0% | 0% | 0% | 0% | 5.00 | 4.22 |

General Instructor Questions
| Count | Excellent | Very Good | Good | Fair | Unsatisfactory | Instructor Mean | FAS Mean | |
|---|---|---|---|---|---|---|---|---|
| Evaluate your Instructor overall. | 4 | 25% | 25% | 25% | 25% | 0% | 3.50 | 4.49 |
| Gives effective lectures or presentations, if applicable | 4 | 50% | 0% | 0% | 50% | 0% | 3.50 | 4.40 |
| Is accessible outside of class (including after class, office hours, e-mail, etc.) | 4 | 25% | 75% | 0% | 0% | 0% | 4.25 | 4.47 |
| Generates enthusiasm for the subject matter | 4 | 100% | 0% | 0% | 0% | 0% | 5.00 | 4.55 |
| Facilitates discussion and encourages participation | 4 | 75% | 25% | 0% | 0% | 0% | 4.75 | 4.49 |
| Gives useful feedback on assignments | 2 | 50% | 0% | 0% | 50% | 0% | 3.50 | 4.46 |
| Returns assignments in a timely fashion | 1 | 100% | 0% | 0% | 0% | 0% | 5.00 | 4.43 |
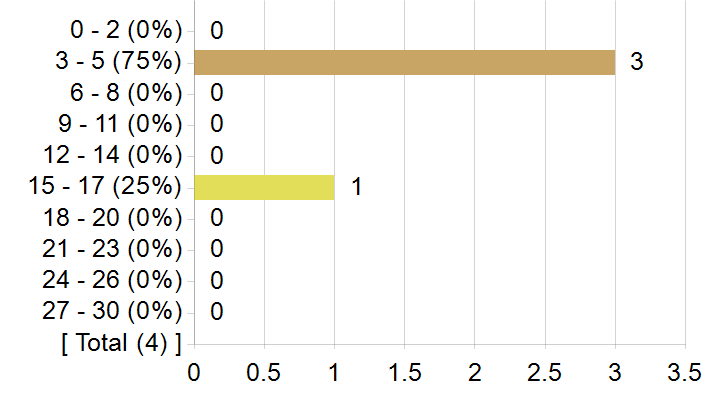
On average, how many hours per week did you spend on coursework outside of class? Enter a whole number between 0 and 168.
Frequency chart and mean excludes students who answered 31 or more hours.
On average, how many hours per week did you spend on coursework outside of class? Enter a whole number between 0 and 168.
| Statistics | Value |
|---|---|
| Response Count | 4 |
| Response Ratio | 67% |
| Mean | 6.75 |
| Median | 4.50 |
| Mode | 3, 4, 5, 15 |
| Standard Deviation | 5.56 |
How strongly would you recommend this course to your peers?
How strongly would you recommend this course to your peers?

| Options | Score | Count | Percentage |
|---|---|---|---|
| Recommend with Enthusiasm | 5 | 1 | 25% |
| Likely to Recommend | 4 | 1 | 25% |
| Recommend with Reservations | 3 | 1 | 25% |
| Unlikely to Recommend | 2 | 0 | 0% |
| Definitely not Recommend | 1 | 1 | 25% |
| Statistics | Value |
|---|---|
| Response Ratio | 67% |
| Mean | 3.25 |
| Median | 3.50 |
| Standard Deviation | 1.71 |
What was/were your reason(s) for enrolling in this course? (Please check all that apply)
| Options | Count |
|---|---|
| Elective | 4 |
| Concentration or Department Requirement | 1 |
| Secondary Field or Language Citation Requirement | 0 |
| Undergraduate General Education Requirement | 0 |
| Expository Writing Requirement | 0 |
| Foreign Language Requirement | 0 |
| Pre-Med Requirement | 0 |
| Divisional Distribution Requirement | 1 |
| Quantitative Reasoning with Data Requirement | 0 |
Comments from students
What would you like to tell future students about this class? (Your response to this question may be published anonymously.)
| Comments |
|---|
| Please take this course! The professor allows for individual interests and is super knowledgeable in African Art. |
| The syllabus is great, and the art traditions we learn about are fantastic. That said, taking it over Zoom was not ideal, and Prof Blier tends to go on tangents/get distracted, which is hard to follow. |